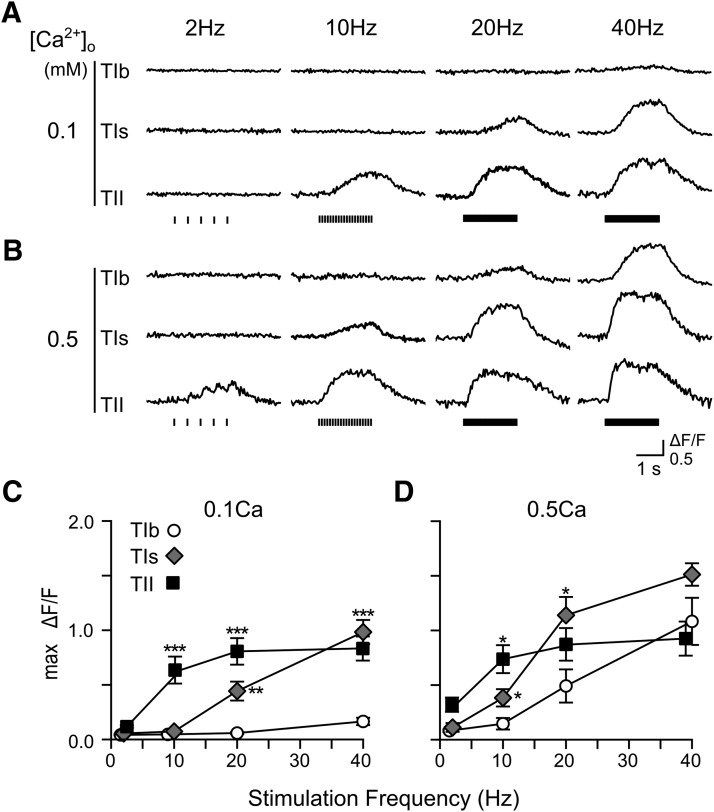
Figure 2.
Frequency responses of GCaMP1.3 Ca2+ signals at different extracellular Ca2+ concentrations. A, B, Example ΔF/F traces for type Ib, Is, and II synaptic boutons stimulated at 2, 10, 20, and 40 Hz in 0.1 and 0.5 mM Ca2+ saline. C, D, Summary line plots showing the frequency responses of averaged max ΔF/F for type Ib, Is, and II synapses at 0.1 mM Ca2+ (C; 8–11 NMJs, same set of data as in Fig. 1 replotted for comparison) and 0.5 mM Ca2+ (D; four NMJs). In this and Figures 4, 10, 13, for each NMJ, one synaptic terminal was measured for each type of motor synapses and readings of all boutons within the same terminal were averaged. See Table 1 for total bouton numbers and corresponding NMJ numbers. For clarity, some data points are displaced horizontally and statistically significant differences against type Ib synapses are indicated at each stimulus frequency. In this figure and Figures 4, 10, 13, 14, error bars indicate SEM. Asterisks denote levels of statistically significant differences (*p < 0.05; **p < 0.01; ***p < 0.001), based on KW tests and Bonferroni correction.

