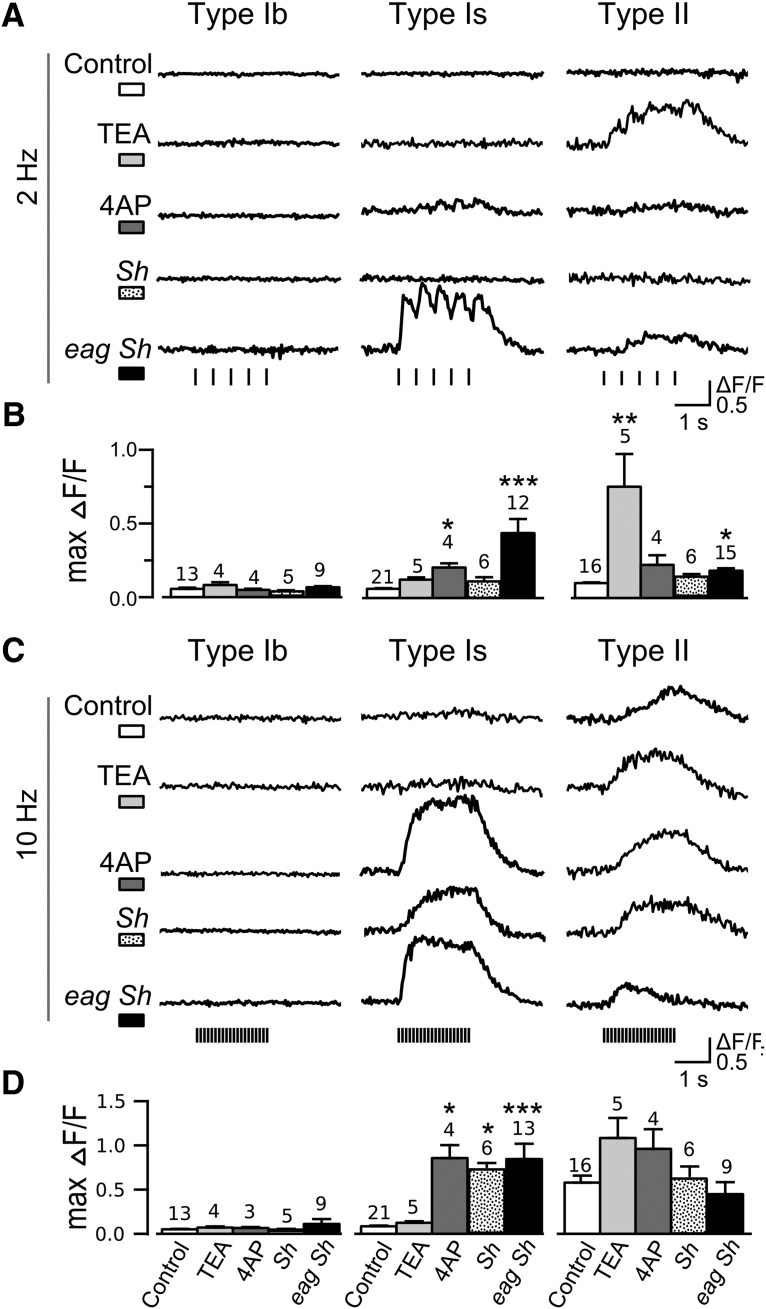
Figure 4.
Genetic and pharmacological dissection of the distinct excitability of type Ib, Is, and II synapses. Representative ΔF/F traces under 2- and 10-Hz stimulations (A, C), comparing WT control, WT with TEA (10 mM) and 4-AP (200 μM) treatments, ShM mutant and double mutant eag1 Sh120. Note the preferential effects of TEA on type II, and 4-AP, ShM and eag1 Sh120 on type Is synapses. B, D, Bar charts for sample statistics corresponding to the traces in A, C, with NMJ numbers and SEMs indicated. KW tests with Bonferroni correction were performed; *p < 0.05, **p < 0.01, ***p < 0.001.

