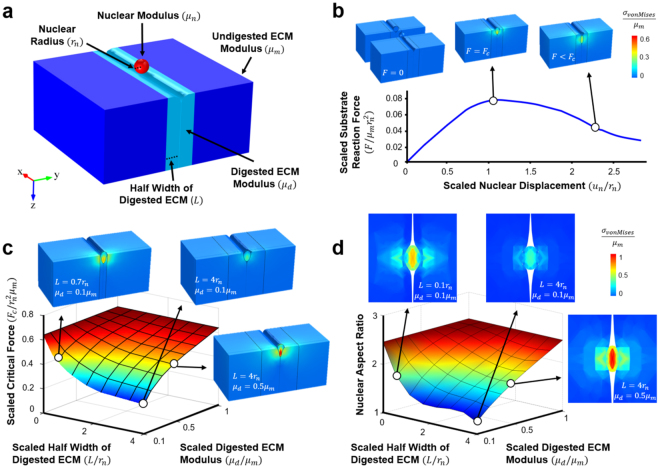
Figure 6.
Computational model for cell migration through organized dense connective tissues. (a) Schematic showing a cell nucleus above a narrow slot in the ECM. The wall of the slot consists of a layer of digested ECM (light blue) that is softer than the undigested ECM outside (dark blue). (b) Simulation of a nucleus moving through a slot. The insets are contour plots showing the von-Mises stresses at the initial, critical, and migrated phases of cell entry. The scaled resistance force on the nucleus () is plotted as as a function of the scaled vertical displacement of the nucleus (). (c) 3D heat map shows the scaled critical force () and (d) nuclear aspect ratio as a function of the scaled digested ECM modulus () and the scaled half width of the digested ECM (). Insets show the von-Mises stresses of the nucleus at the critical force and top down views of the nucleus within the slot.

