Fig. 2.
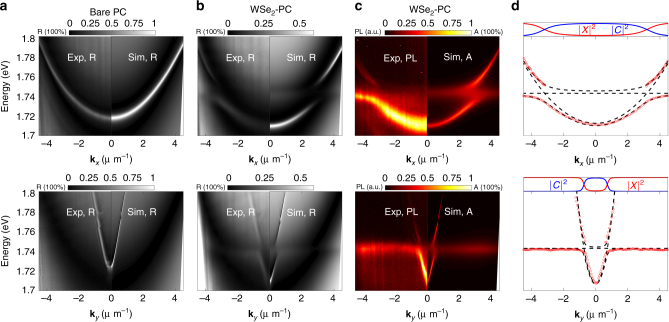
Strong coupling between TE-polarized WSe2 exciton and PC modes measured by angle-resolved reflectance and PL at 10 K. The top/bottom row shows the along-bar/cross-bar directions, respectively. The left/right panels of a–c show the measured/simulated results, respectively. a Angle-resolved reflectance spectra of the bare PC, showing a sharp, dispersive PC mode. b Angle-resolved reflectance spectra of the WSe2-PC integrated device, showing split, anti-crossing upper and lower polariton modes. c Angle-resolved PL data (left) compared with the simulated absorption spectra of the WSe2-PC integrated device, showing the same anti-crossing polariton modes as in b. d The polariton energies ELP,UP vs. wavevector kx, ky obtained from the spectra in c. The lines are fits to the LP and UP dispersion with the coupled harmonic oscillator model, giving a vacuum Rabi splitting of 18.4 and 16.1 meV for the along-bar (top) and cross-bar (bottom) directions, respectively. The corresponding Hopfield coefficients |C2| and |X2|, representing the photon and exciton fractions in the LP modes, respectively, are shown in the top sub-plots

