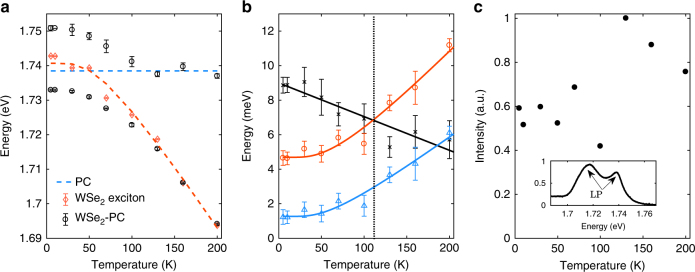
Fig. 3.
Temperature dependence of the WSe2-PC system. a The temperature dependence of the exciton, cavity, and polariton energies. The exciton energy Eexc(T) is measured from the weakly coupled TM excitons (red diamonds) and is extracted by fitting the PL spectrum using Gaussian line shape. Temperature dependence of the exciton is fitted by Eq. (6) (dashed blue line). The cavity energy Ecav(T) is found to be approximately constant with temperature and indicated by the dashed blue line. The polariton energies ELP,UP(T) (black circles) are extracted by fitting the PL spectra at kx = 3.1 μm−1, ky = 0 μm−1 using Gaussian line shape. They anti-cross and split from the exciton and PC mode energies at 100 K and below, showing strong coupling in this range. All the error bars are extracted by least square data fitting. b The strong coupling to weak-coupling transition measured by the temperature dependence of g (black stars), (red circles), and (γexc − γcav)/2 (blue triangles). The red and blue lines are fits by Eq. (7) for γexc while γcav is approximately constant with temperature. g drops to below at about 115 K, showing the transition to the weak-coupling regime as indicated by the dashed line. Rabi splitting persists up to about 185 K, till g becomes smaller than (γexc − γcav)/2. All the data points are extracted by fitting the PL spectrum using Gaussian line shape, and the error bars are extracted by least square data fitting. c Temperature dependence of the integrated PL intensity of the PC-WSe2 polariton, showing only mild change in intensity. The inset shows the spectrum at 10 K integrated over θx = −30° to 30° and over the spectral range shown. The higher energy side shoulder corresponds to exciton-like LP emission at large θx where the density of states is high

