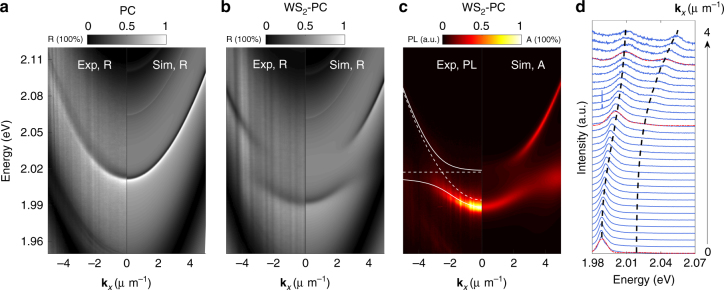
Fig. 4.
Room-temperature strong coupling between TE-polarized WS2 exciton and PC modes measured by angle-resolved reflectance and PL. The left/right panels are the measured/simulated results, respectively. a Angle-resolved reflectance spectra of the bare PC, showing a sharp, dispersive PC mode. b Angle-resolved reflectance spectra of the WS2-PC integrated device, showing split, anti-crossing upper and lower polariton modes. c Angle-resolved PL data (left) compared with the simulated absorption spectra of the WS2-PC integrated device, showing the same anti-crossing polariton modes as in b. The solid lines are the fitted polariton dispersion, with a corresponding vacuum Rabi splitting of 22.2 meV. Dashed lines represent the exciton and cavity photon dispersion. d Normalized PL intensity spectra from c for kx = 0 μm−1 (bottom) to kx = −4 μm−1 (top). From Gaussian fits to the spectra (see Supplementary Figure 5 for examples), we extract the polariton energies at each wavevectors. The black dashed lines mark the fitted LP and UP positions, corresponding to the white solid lines marked in c

