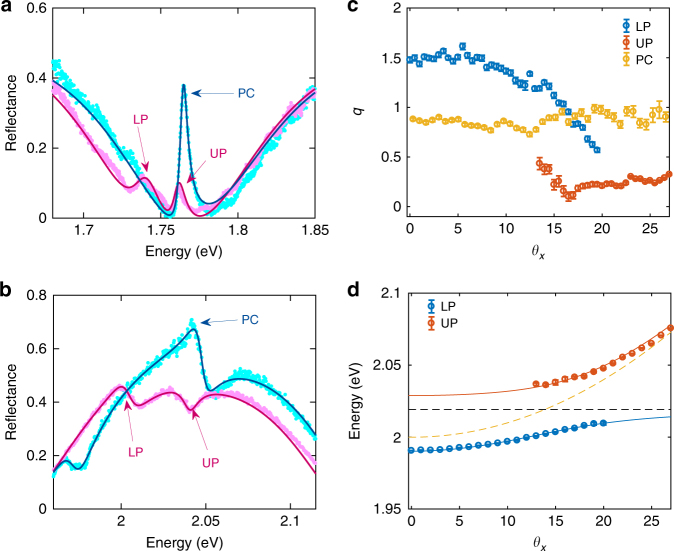
Fig. 5.
Fano resonance in the reflectance of the a WSe2 and b WS2 systems, measured at θx = 24° and 17.5°, respectively. Blue dots are the reflectance spectra of the bare PCs, and red dots, the TMD-PC devices. The lines are comparison with Fano line shape given by Eq. (4). The asymmetry parameter q for PC, LP, and UP in WSe2 system is 5.0, 3.5, and 4.1 respectively, and in WS2 system, is 0.93, 0.83, and 0.18. c The fitted asymmetry parameter q as a function of angle from the reflection of WS2 bare PC (yellow circles) and WS2-PC device (blue and red circles). d Extracted lower and upper polariton energies as a function of angle, as indicated by red and blue circles, respectively. Red and blue solid lines are the fittings. Yellow and black dashed lines represent the cavity and exciton dispersion. All the data points are extracted by fitting the reflection spectrum in the left panel of Fig. 4b using Eq. (4), and the error bars are extracted by least square data fitting

