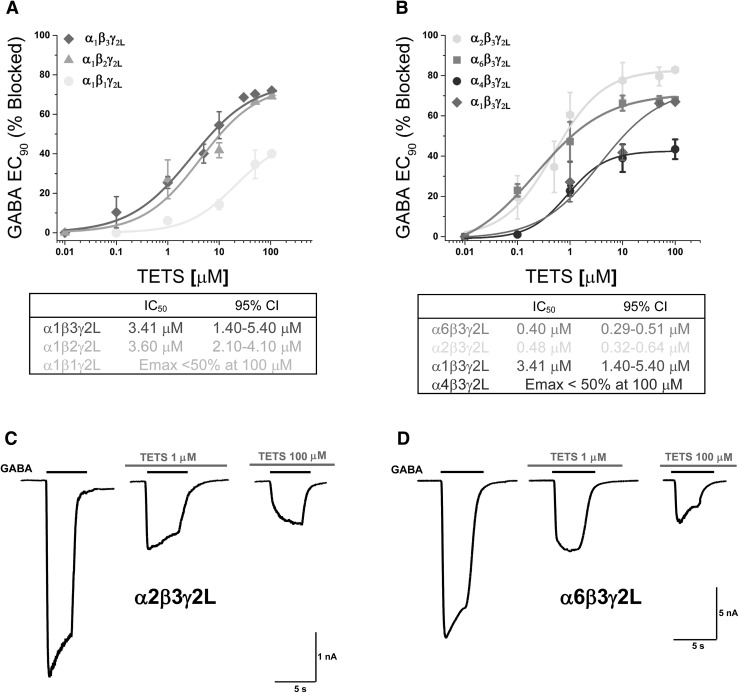
Fig. 3.
a Concentration–response curves comparing TETS inhibition of different β subunits in the α1βXγ2L combination. b Comparison of TETS inhibition of α1, α2, α4, and α6 subunits in αXβ3γ2L containing GABAA receptor combinations. Individual data points are presented as mean ± SD from 3–8 independent recordings. EC50 values are presented with 95% confidence intervals. Example traces showing TETS inhibition of α2β3γ2L (c) and α6β3γ2L (d) receptors. EC90 GABA was applied first alone as control and then in the presence of 1 or 100 μM of TETS

