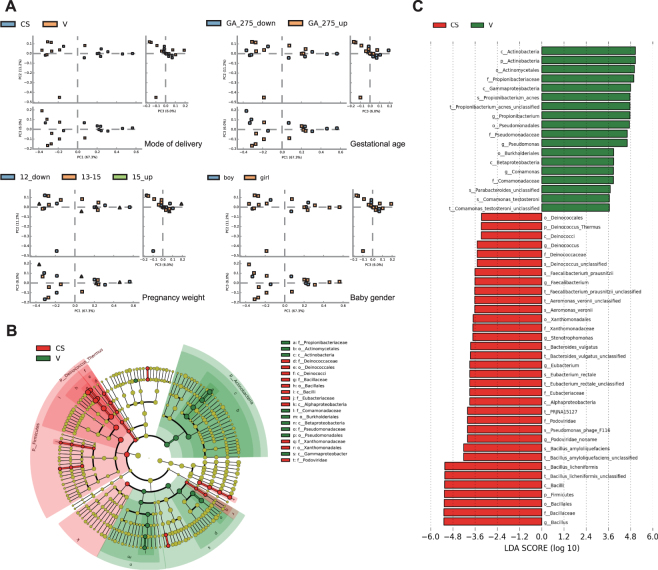
Figure 1.
Comparison of the microbiomes of vaginally delivered and C-section-delivered newborns. (A) Principal-component analysis (PCA) plot based on the relative taxa abundance in the fecal microbiomes of neonates with mode of delivery, gestation age, pregnancy weight or gender groups. Sample are marked by the group type. The number is the grouping boundaries. (B) LEfSe comparison of microbiomes from meconium samples from vaginally delivered and C-section-delivered neonates. Enriched taxa in samples from vaginally delivered infants with different level classifications with a positive linear discriminant analysis (LDA) score are shown in green; C-section samples with a negative LDA score are shown in red (>3.5 in both cases). (C) Cladogram derived from LEfSe analysis of metagenomic sequences from C-section delivered newborn and vaginally delivered neonate meconium samples. Green shaded areas indicate microbe orders that more consistently describe the fecal microbiome from vaginally delivered infants; red shaded areas indicate microbe orders that more consistently describe the meconium microbiome from C-section-delivered infants. The prefixes “p”, “c”, “o”, “f”, “g”, “s”, and “t” represent the annotated level of phylum, class, order, family, genus, species and strain.

