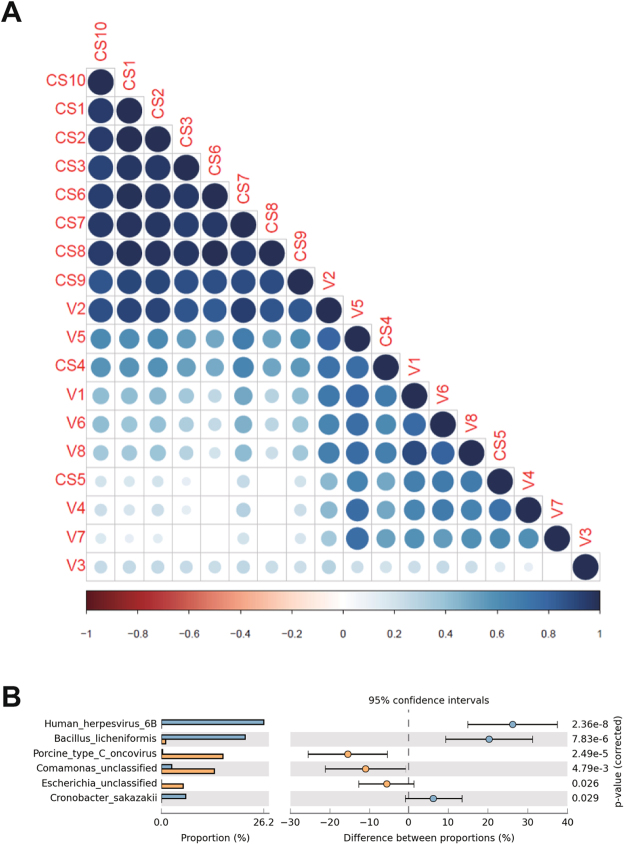
Figure 2.
Spearman correlation heat map analysis showed that the fecal microbiomes from IVF infant samples were clustered with those from the vaginally delivered infant samples. (A) CS4 and CS5 samples represent IVF neonates whose fecal microbiomes clustered with those from the vaginally delivered infants. (B) Distribution of the relative abundance of taxa between the CS4 and CS5 IVF samples. Horizontal bars indicate 95% confidence intervals from the mean proportion.

