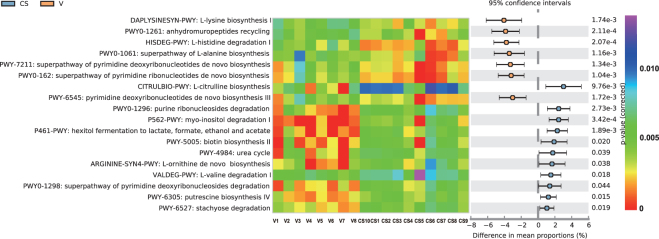
Figure 4.
Extended error bar plots showing functional properties that differ between C-section and vaginally delivered neonate gut microbiomes. Species identified by LEfSe as different between the two groups are depicted. The proportion (left side) indicates the possible abundance of microbes possessing each functional feature and the difference between proportions for each feature. For this analysis, features were filtered by the q value (0.05) and effect size (0.01). Blue indicates the C-section group; orange indicates the vaginal group.

