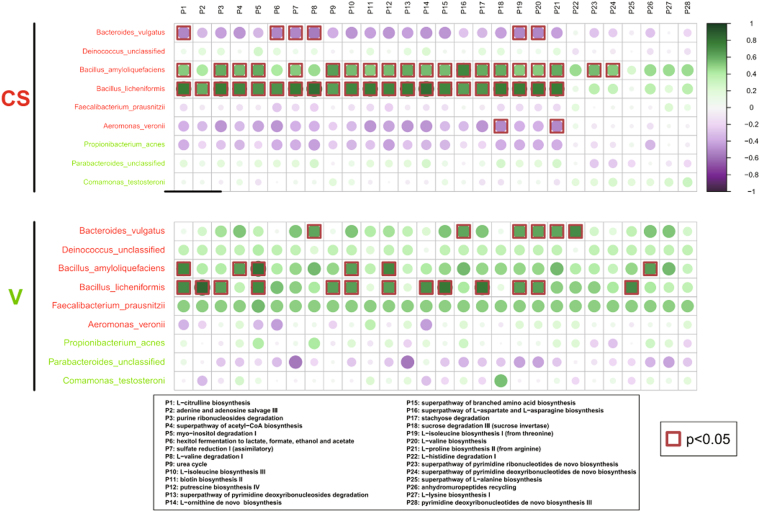
Figure 6.
Microbial metabolic differences in the meconium microbiome between vaginally delivered and C-section-delivered neonate samples. Genera identified by LEfSe as different between the two biological samples are depicted. Metabolic pathway designations are delineated at the bottom of the figure. The shading intensity and size of the circles indicate the Kendall rank correlation coefficient between matrices. Negative correlations are shown in violet, and positive correlations are shown in blue. Red squares surrounding the circles are indicative of a P value ≤ 0.05.

