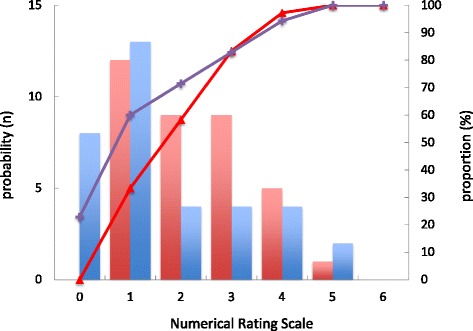
Fig. 2.

Histogram and cumulative probabilities of maximal postoperative pain during the 48 h after surgery in patients who underwent BCS with TIVA or TIVA + PECSB. Red and blue bars denote the frequencies of NRS in the TIVA and TIVA + PECSB groups, respectively. Red triangles and purple crosses denote cumulative distributions of NRS within the 48 h after surgery in the TIVA and TIVA + PECSB groups, respectively
