FIGURE 3.
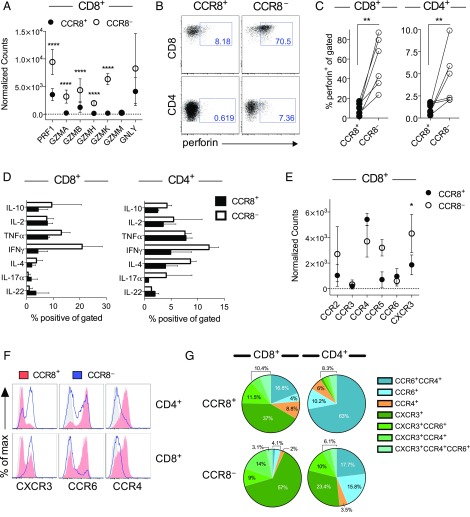
Effector phenotype and function of CCR8− skin T cells. (A) Gene expression counts for cytolytic molecules among CD8+ T cells from all skin samples (n = 5). (B) Representative dot plots showing perforin expression for gated CD8+CCR8+ and CD8+CCR8− T cells. (C) Percent frequencies of perforin+ cells within the indicated subsets of skin T cells plotted for each donor (n = 6). (D) Dermal T cells were stimulated ex vivo and analyzed for cytokine production by flow cytometry. Percent frequencies of IFNγ+, IL-4+, TNF-α+, IL-17a+, and IL-22+ cells among CCR8+ and CCR8− T cells within the CD8+ (left) and CD4+ subsets (right) plotted as mean ± SD (n = 2). (E) Gene expression counts for inflammatory chemokine receptors among CD8+ T cells from all skin samples (n = 5). (F) Representative histograms showing the expression of CXCR3, CCR6, and CCR4 among CCR8+ (red) and CCR8− T cells (blue) within the CD4+ (top) and CD8+ subsets (bottom). (G) Pie charts showing the relative distribution of chemokine receptors among the indicated subsets of skin T cells (n = 6). ****p < 0.0001, **p < 0.01, *p < 0.05.

