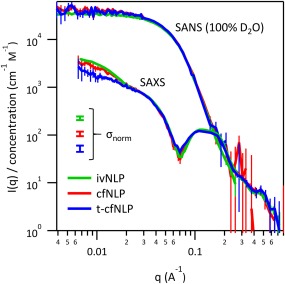
Figure 3.

Comparison of SANS/SAXS data from different NLP preparations. Data were placed on an absolute intensity scale and normalized by molar concentration of MSP. Incoherent backgrounds were subtracted from the SANS data. No significant differences were seen between the scattering curves of NLPs prepared by different methods, and we concluded that there were no detectible structural differences between the NLPs. Small differences seen at very low q are discussed in the text. Error bars are plus or minus one standard deviation. Error bars on data points represent the uncertainty due to counting statistics. In addition, the uncertainty due to normalizing by protein concentration (σnorm) is illustrated with separate error bars; these represent a systematic vertical shift of the entire curve within this error.
