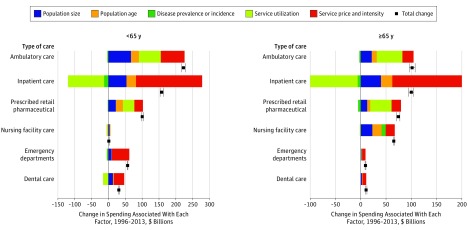
Figure 6. Spending Changes Associated With Each Factor in the 5-Factor Decomposition by Type of Care and Age Category, 1996-2013.
Each colored bar corresponds to 1 of 5 factors and reflects the amount of spending change associated with that factor. Bars to the left of the black vertical line (no change) indicate factors associated with decreased spending; to the right of the line, factors associated with increased spending within that type of care. The sum of the 5 bars equals the total spending change, 1996 through 2013, indicated with a black square marker. Error bars indicate uncertainty intervals.

