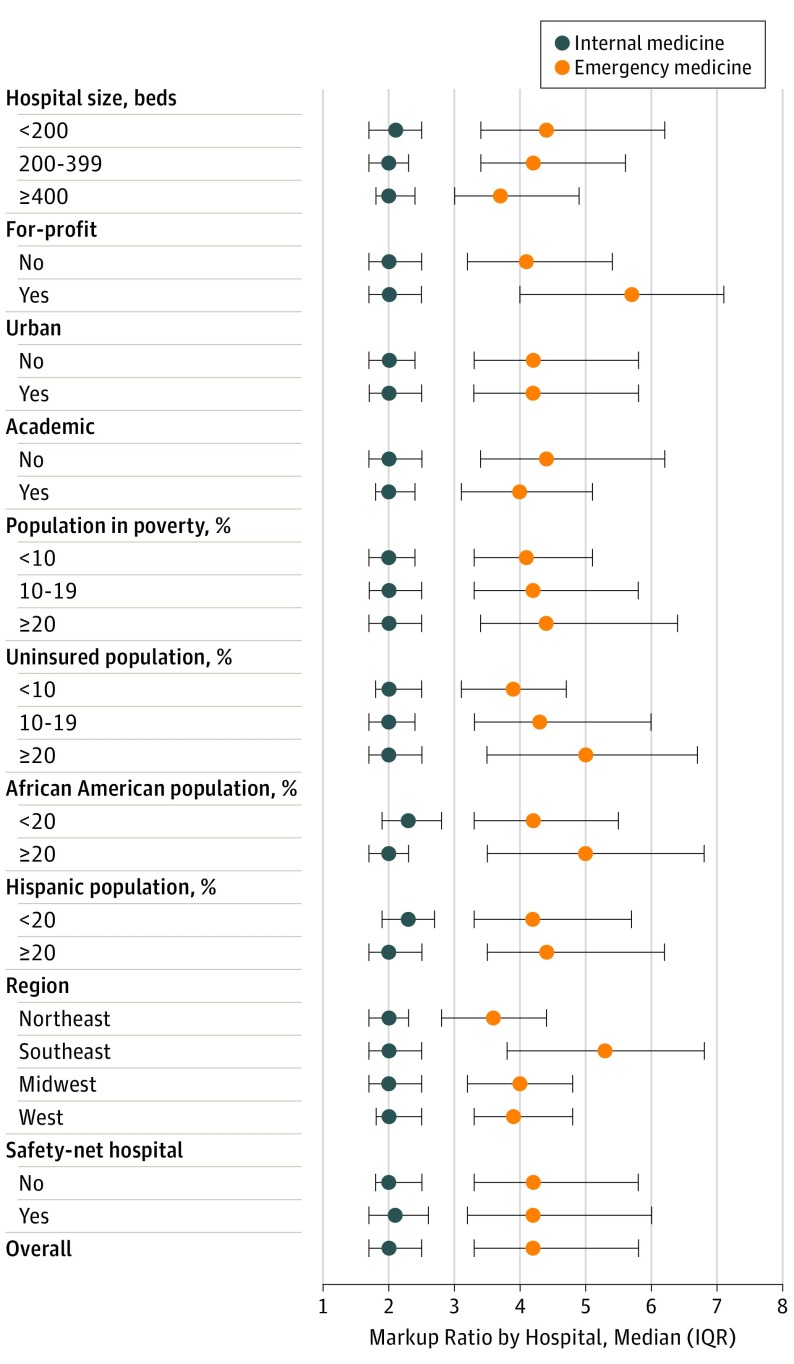
Figure 2. Hospital Characteristics Associated With Higher Markup Ratios in Emergency Departments (n = 2707) and Internal Medicine Departments (n = 3669).
Shown are hospitals’ aggregated markup ratios (median and interquartile range [IQR]) for all services provided in the emergency department (ED) or internal medicine department in 2013. A 1-U increase in the ED markup ratio means that, for every $100 in Medicare-allowable amount billed, the ED charged an additional $100. Multivariable regression coefficients are given in the eTable in the Supplement.

