
Figure 5. Distribution of Percentage of Time in the Therapeutic Range (PTTR) for Patients Stratified by the Absolute Difference in the Predicted Initial Dose of Warfarin and by Self-described Race.
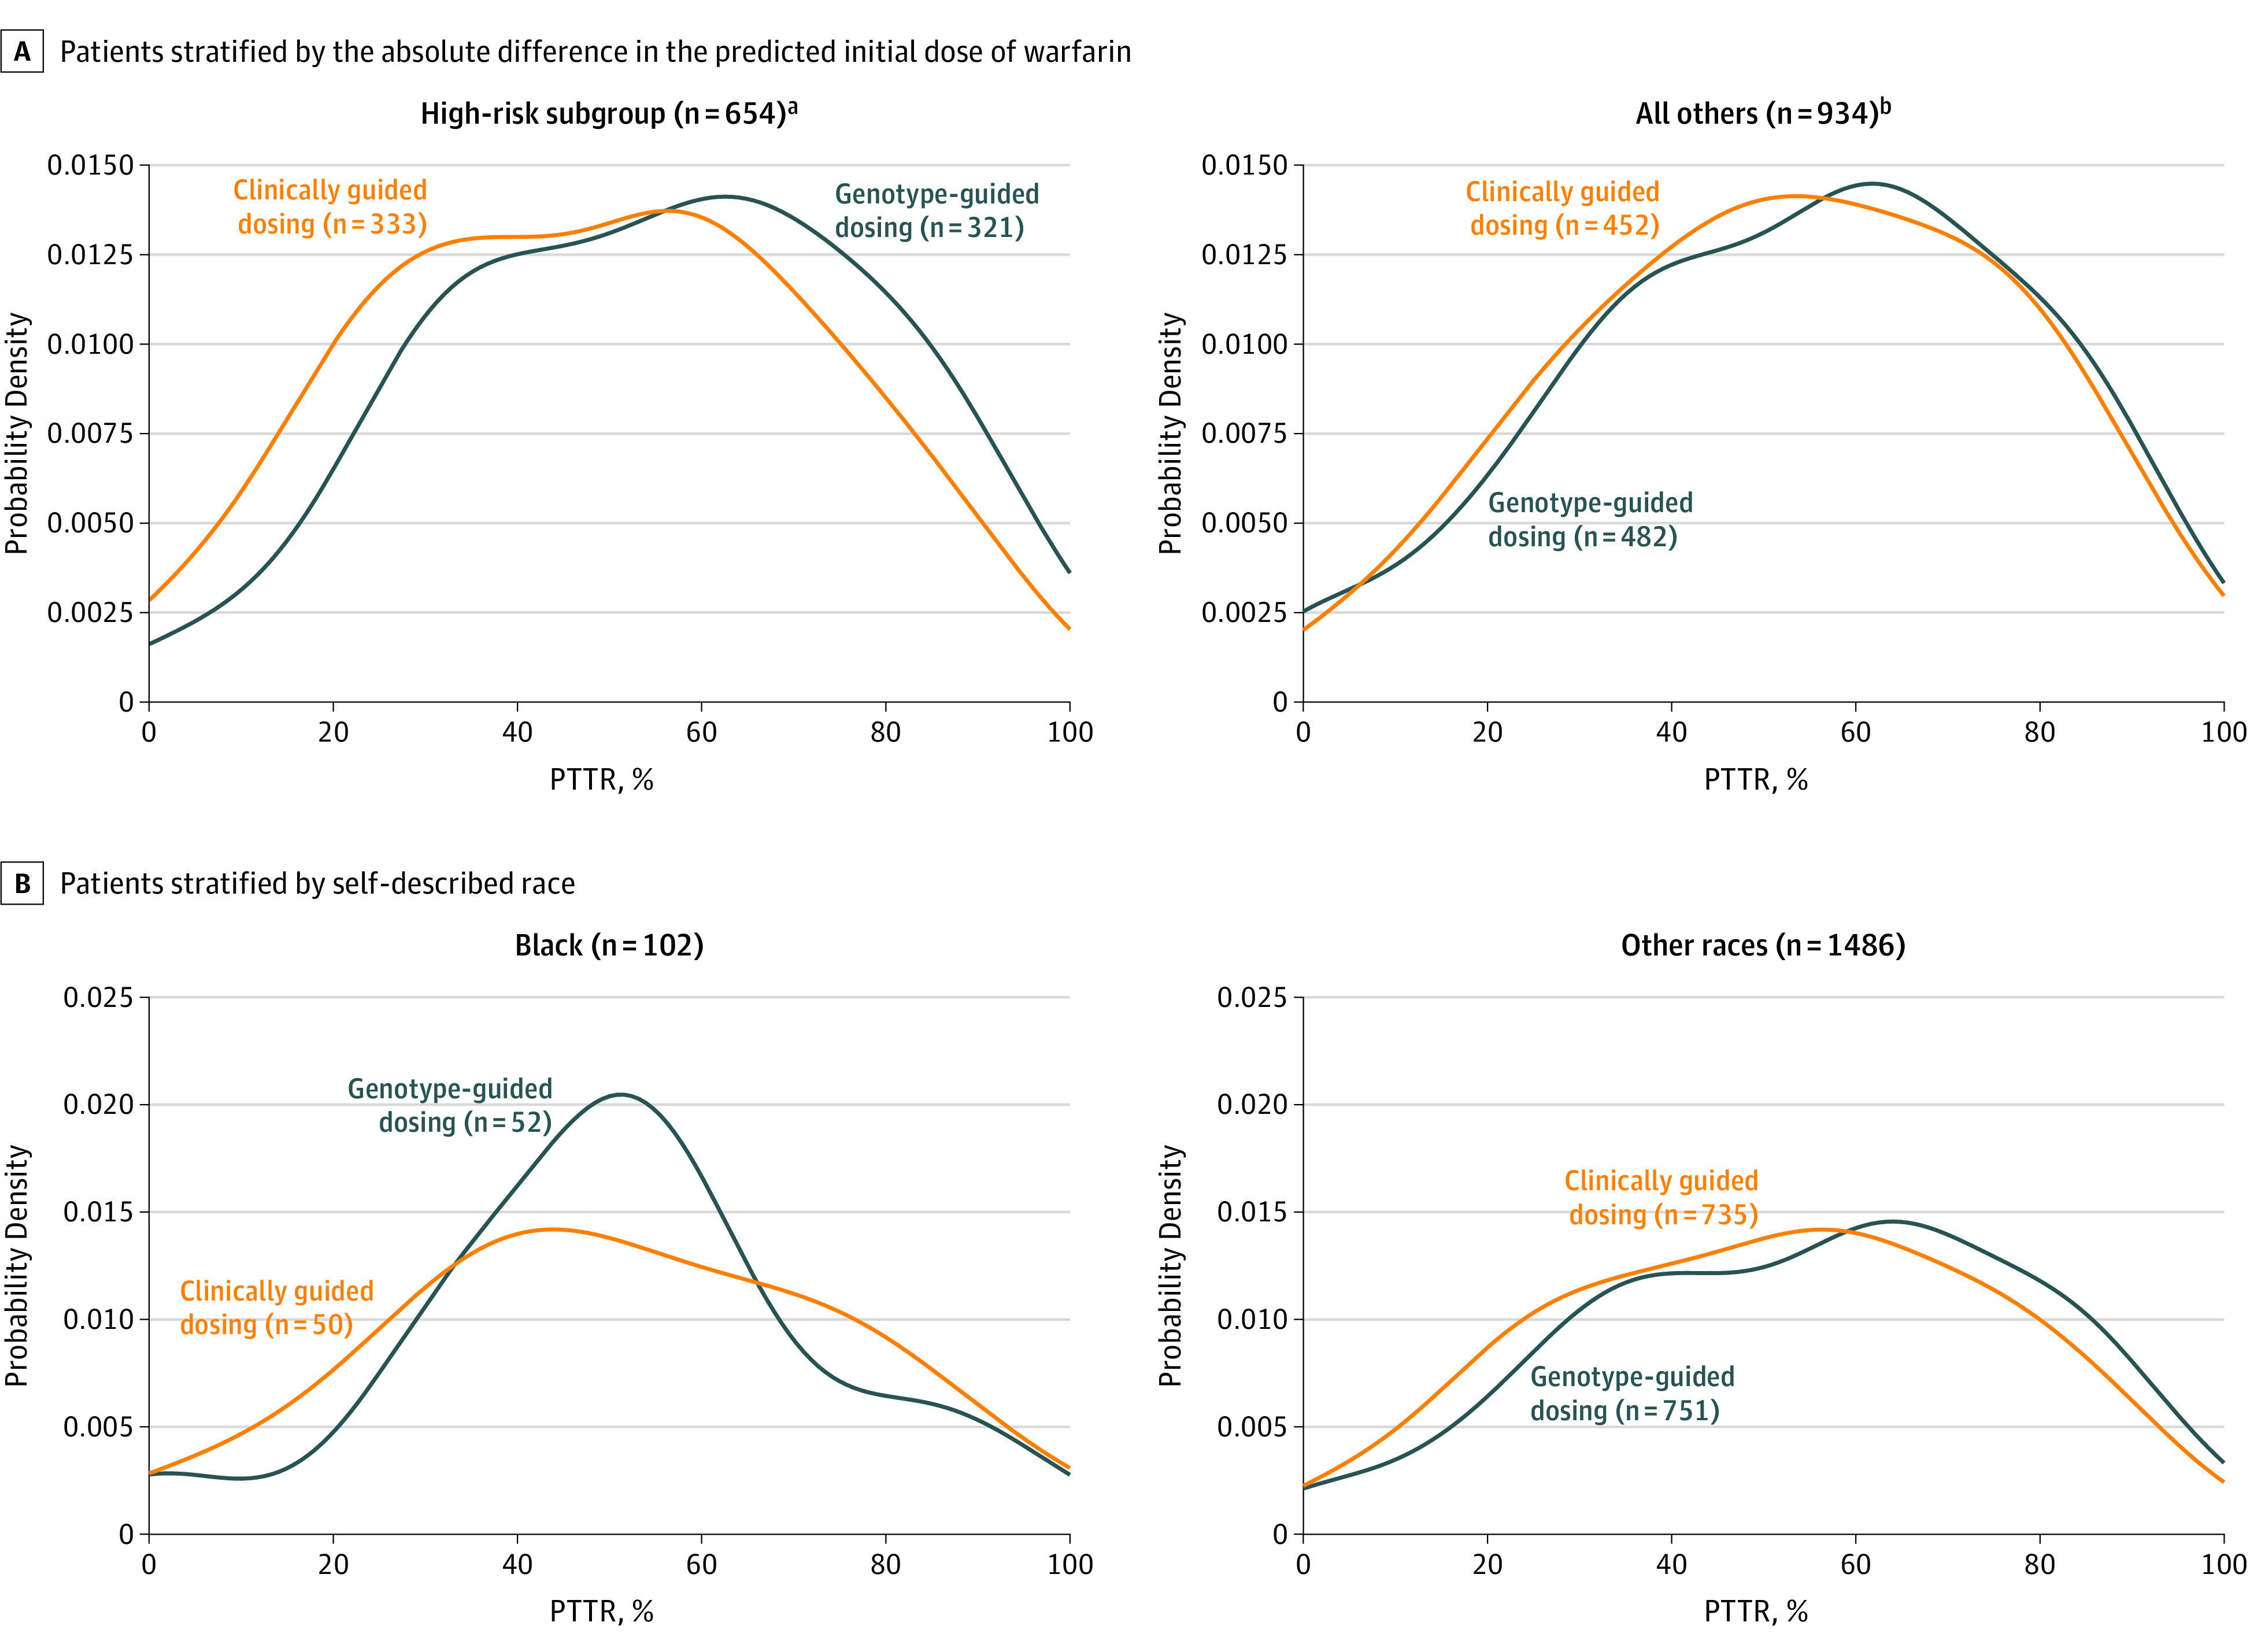
Plots show the probability densities of the PTTR of the international normalized ratio values from days 4 through 28 of warfarin therapy.
aPatients whose clinically guided vs genotype-predicted doses of warfarin differed by 1.0 mg/d or greater (according to baseline genotype and clinical algorithms).
bPatients whose clinically guided vs genotype-predicted doses of warfarin differed by less than 1.0 mg/d (according to baseline genotype and clinical algorithms).