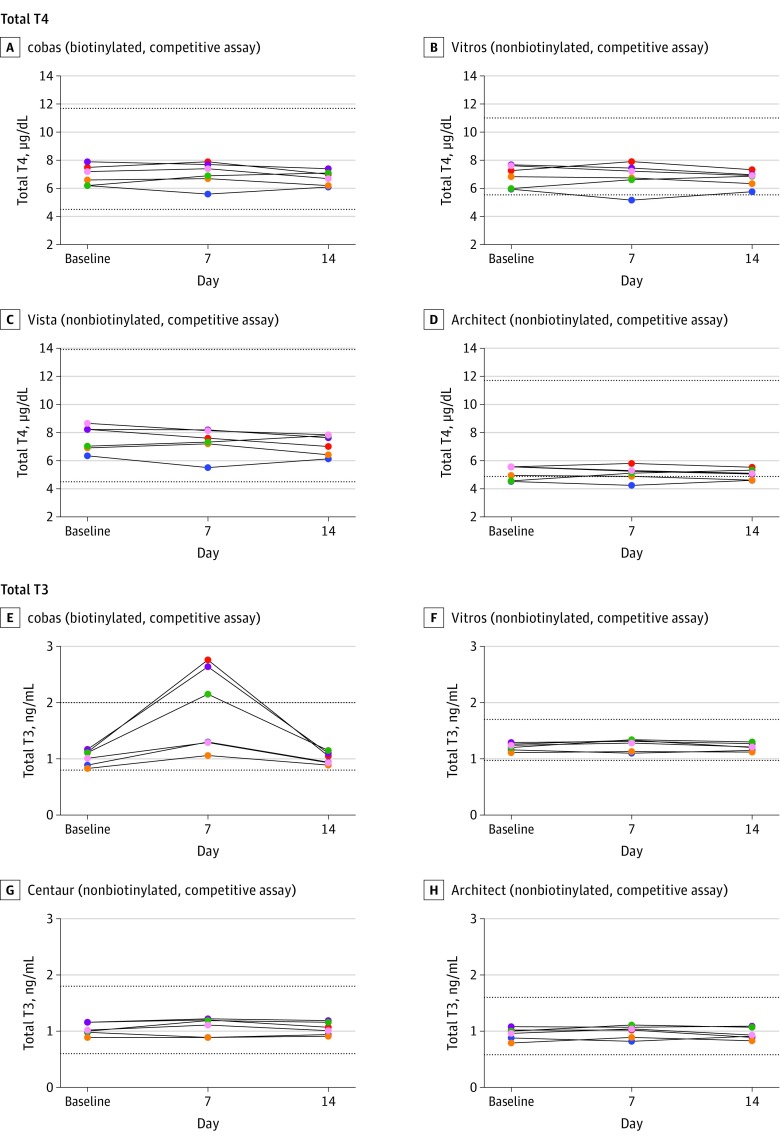
Figure 2. Concentrations of Total Thyroxine (T4) and Total Triiodothyronine (T3) From the 6 Study Participants.
Taking 10 mg/d of biotin for 7 days was associated with falsely increased results from the Roche cobas e602 Total T3 (P =.001). A unique color is used for each participant across all panels. The dotted lines represent the lower and the upper reference range for each assay. Architect indicates Abbott Architect 2000; Centaur, Siemens Centaur XP; cobas, Roche cobas e602; Vista, Siemens Vista Dimension 1500; and Vitros, OCD Vitros 5600. For SI conversion factors, see the Methods section.

