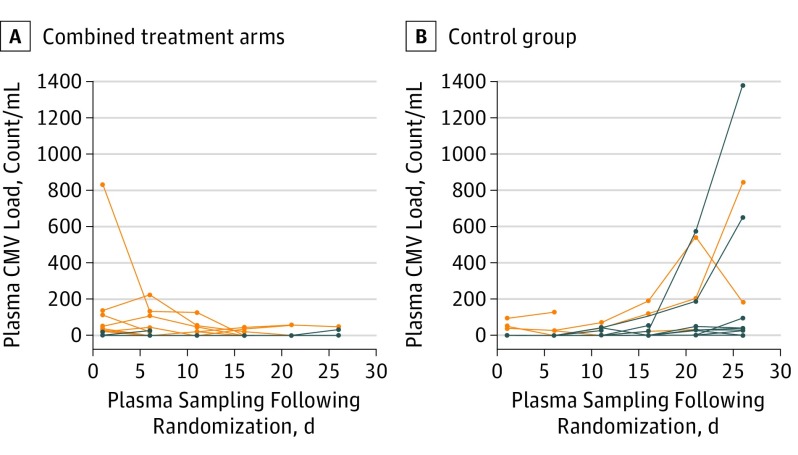
Figure 2. Cytomegalovirus (CMV) Viral Load in Blood .
A, Combined valacyclovir and valganciclovir arms. B, Control group. Each line represents a single patient. Orange lines represent patients who had CMV viremia on the day of enrollment and thus were excluded from the primary analysis of time to CMV reactivation. All enrolled patients are included in graphs to show differences in viral load over time with or without antiviral prophylaxis.

