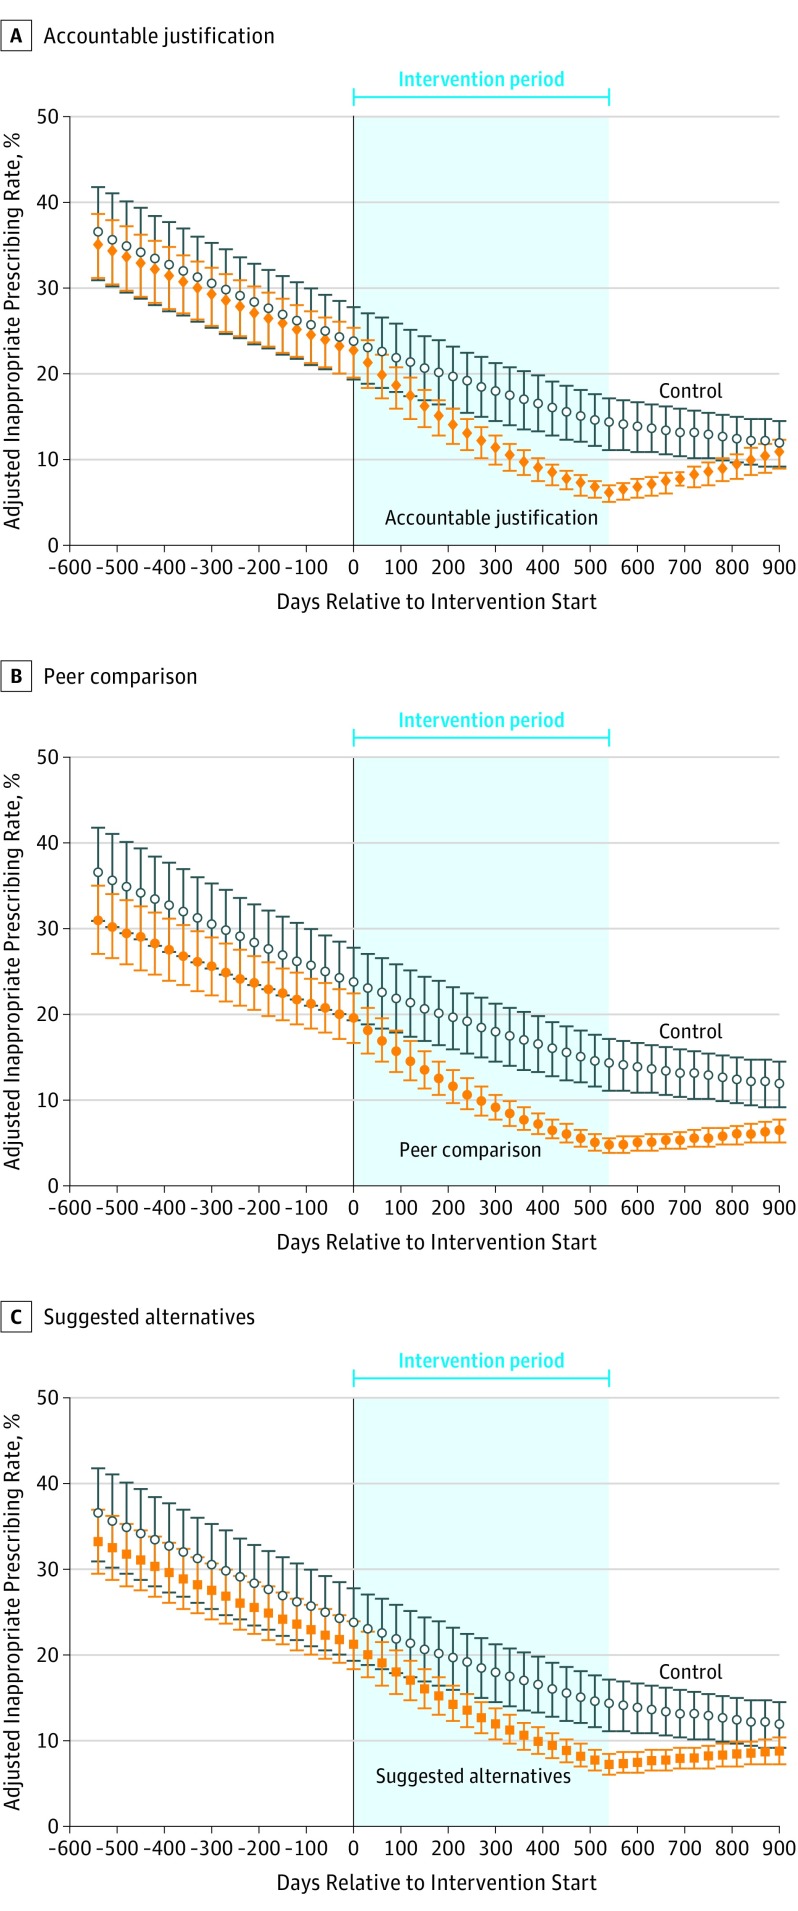
Figure. Adjusted Rates of Antibiotic Prescribing for Antibiotic-Inappropriate Acute Respiratory Tract Infection Visits by Intervention.
Antibiotic prescribing rates at primary care office visits over time for each intervention are marginal predictions from hierarchical regression models of intervention effects, adjusted for concurrent exposure to other interventions and clinician and practice random effects. Error bars indicate 95% CIs. Interventions started at day 0 and ended at day 540. The plot in Panel A differs slightly during the intervention period from Panel 2 of the study by Meeker et al due to attrition of 5 clinicians, who were not included in this analysis.

