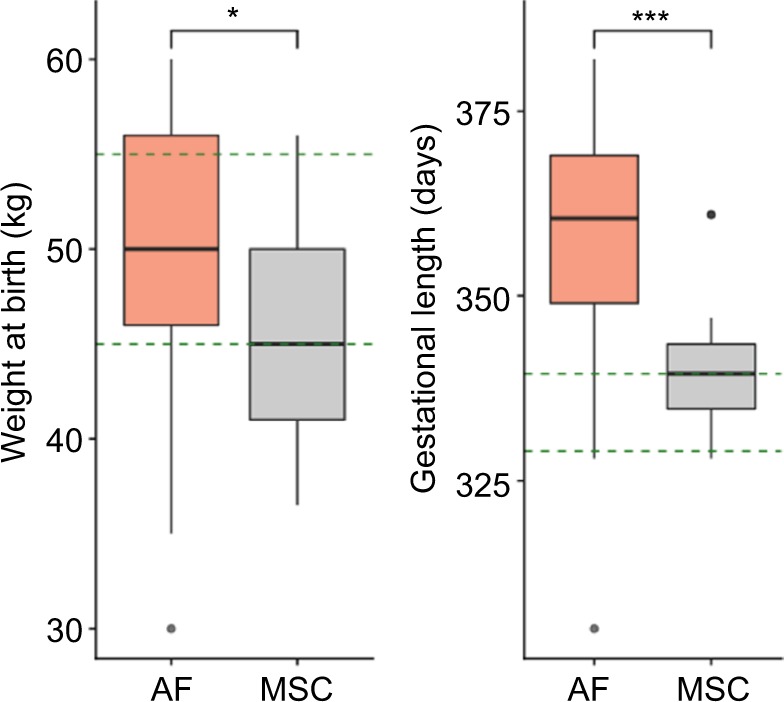
Figure 3.

Weight at birth and gestational length of the AF and MSC cloned groups.
Notes: The green dashed lines are delimiting the range of normality according to information obtained from artificial insemination foals. Both weight at birth and gestational length were higher in the AF group compared to the MSC group (Student’s t-test, *p<0.05; ***p<0.001).
Abbreviations: AF, adult fibroblasts; MSC, mesenchymal stem cell.
