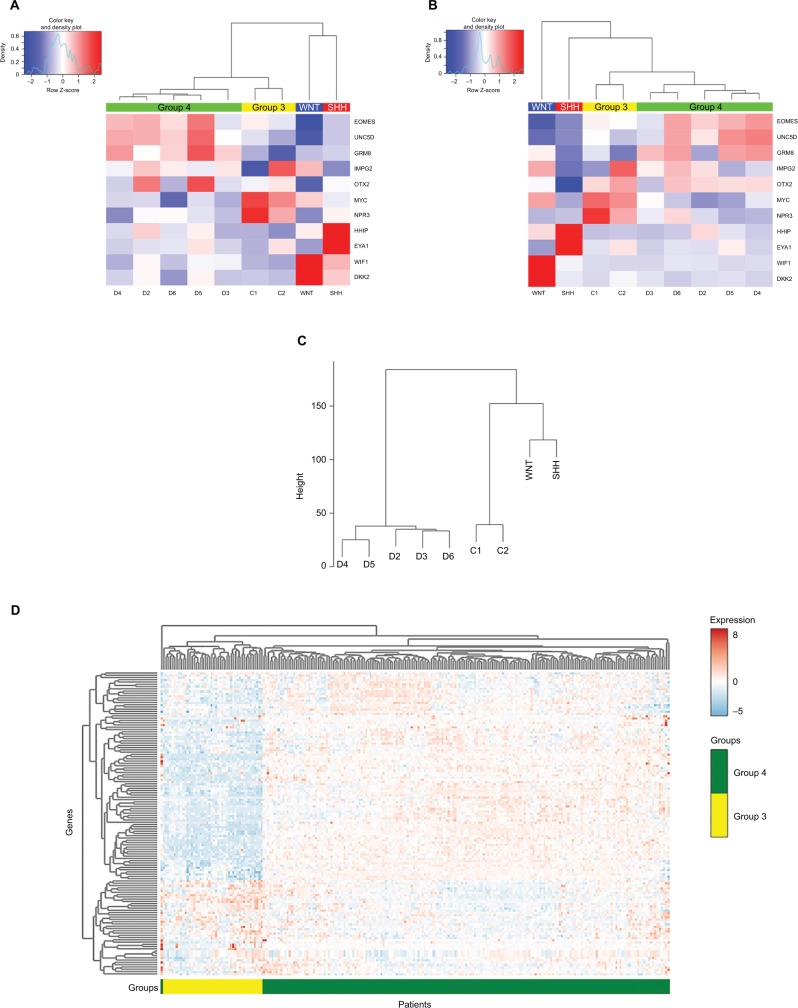
Figure 2.
Heat-map showing differential expression of protein-coding genes in the nine tumor tissues, according to (A) qPCR analysis (−ΔCT) and (B) RNA-seq analysis (log CPM). Graphically displayed results of unsupervised hierarchical clustering. (C) Hierarchical clustering of the genes across the different subgroups using ANOVA (FDR <0.05). Patient symbols are detailed in Table S1. (D) Expression heat-map of the differently expressed genes between Group 4 and other MB subgroups (FDR <0.05). The values were taken from the public data set GSE37385 (Group 3=46, Group 4=188).
Abbreviations: qPCR, quantitative PCR; MB, medulloblastoma; RNA-seq, RNA sequencing; CPM, counts per million; ANOVA, analysis of variance; FDR, false discovery rate; SHH, sonic hedgehog; WNT, wingless-type.

