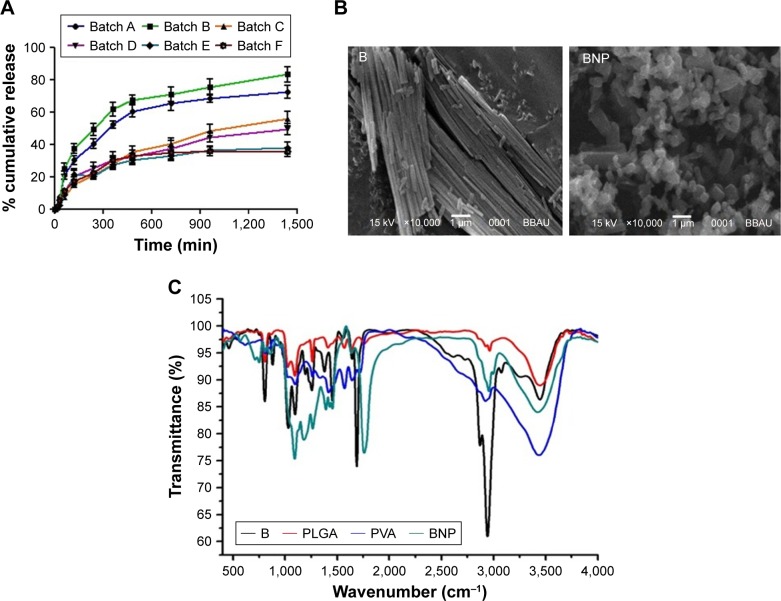
Figure 2.
Drug release profile, SEM imaging and FTIR spectrum.
Notes: (A) In vitro release profile of BNP preparations. Results are expressed as mean ± SD (n=3). (B) SEM images of B and BNP (optimized batch B). (C) FTIR spectrum of PVA, PLGA, B and BNP.
Abbreviations: BNP, B nanoparticles; SD, standard deviation; SEM, scanning electron microscopy; B, betulinic acid; FTIR, Fourier-transform infrared; PVA, polyvinyl alcohol; PLGA, poly(lactic-co-glycolic acid).

