Figure 1.
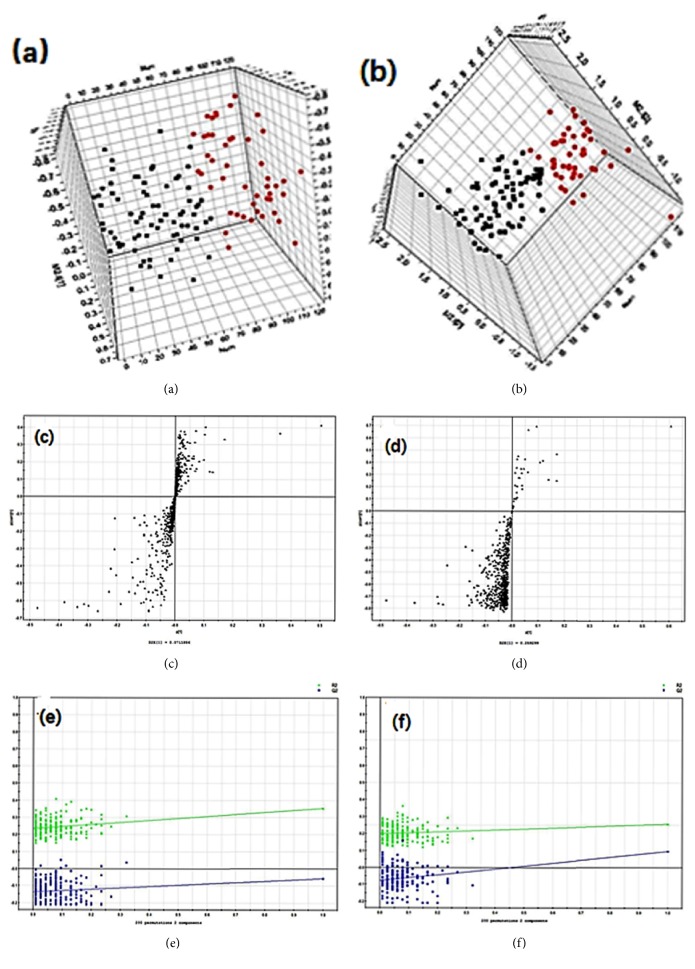
Multivariate data analysis. (a) PLS-DA score map for the HUP and LUP patients in positive mode; (b) PLS-DA score map for the HUP and LUP patients in negative mode; (c) S-plot of the PLS-DA model in positive mode; (d) S-plot of the PLS-DA model in negative mode; (e) validation plot obtained from 200 permutation tests in positive mode; (f) validation plot obtained from 200 permutation tests in negative mode.

