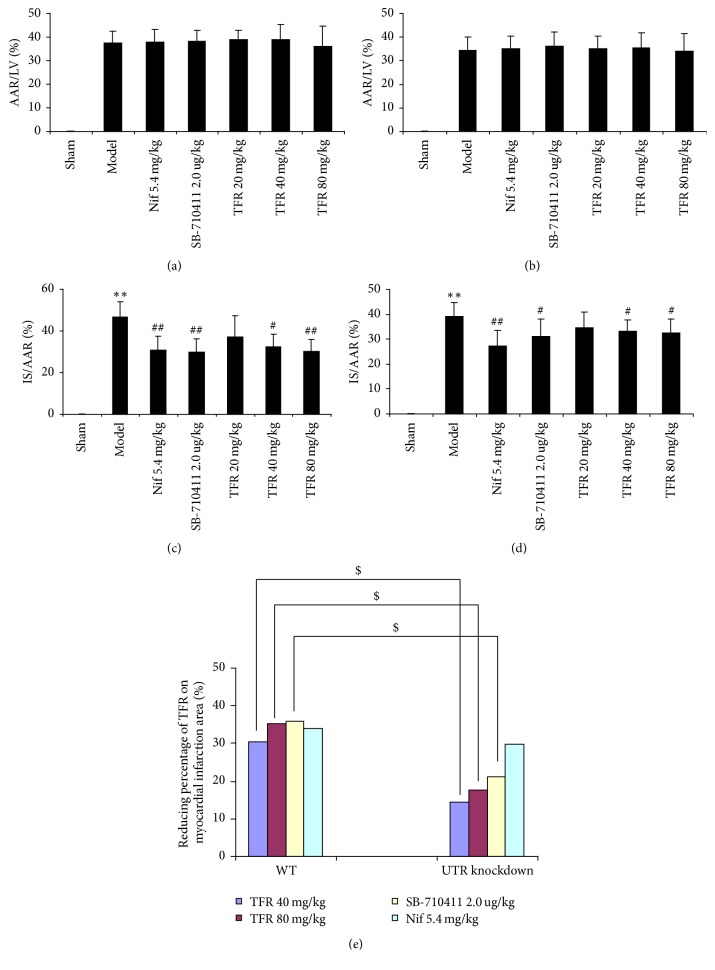
Figure 3.
ARR and IS in each group's rats. (a) Effect of TFR on the ARR in WT rat. (b) Effect of TFR on the ARR in UTR knockdown rat. ARR was expressed as a percentage of the left ventricular area (AAR/LV). (c) Effect of TFR on the IS in WT rats. (d) Effect of TFR on the IS in UTR knockdown rats. The IS was normalized by expressing it as a percentage of the ARR (IS/AAR). (e) Reducing percentage of TFR on myocardial infarction area. Results are expressed as mean ± SD (n = 8, each group). ∗∗p < 0.01 versus the sham group; #p < 0.05 and ##p < 0.01 versus the model group; $p < 0.05 versus WT rats.

