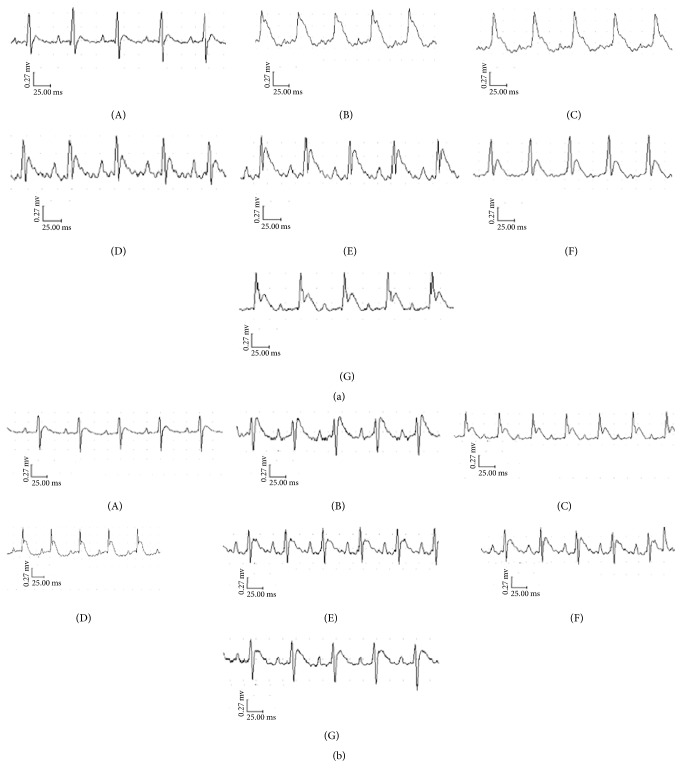
Figure 4.
The traces of the ECG in each group. Rats were subjected to 30 min of myocardial ischemia followed by 90 min of reperfusion, and electrocardiogram (ECG) was measured. (a) The traces of the ECG in each group of WT rats. (b) The traces of the ECG in each group of UTR knockdown rats. (A): sham; (B): model; (C): 5.4 mg/kg nifedipine; (D): 2.0 μg/kg SB-710411; and (E)~(G): 20, 40, and 80 mg/kg TFR.

