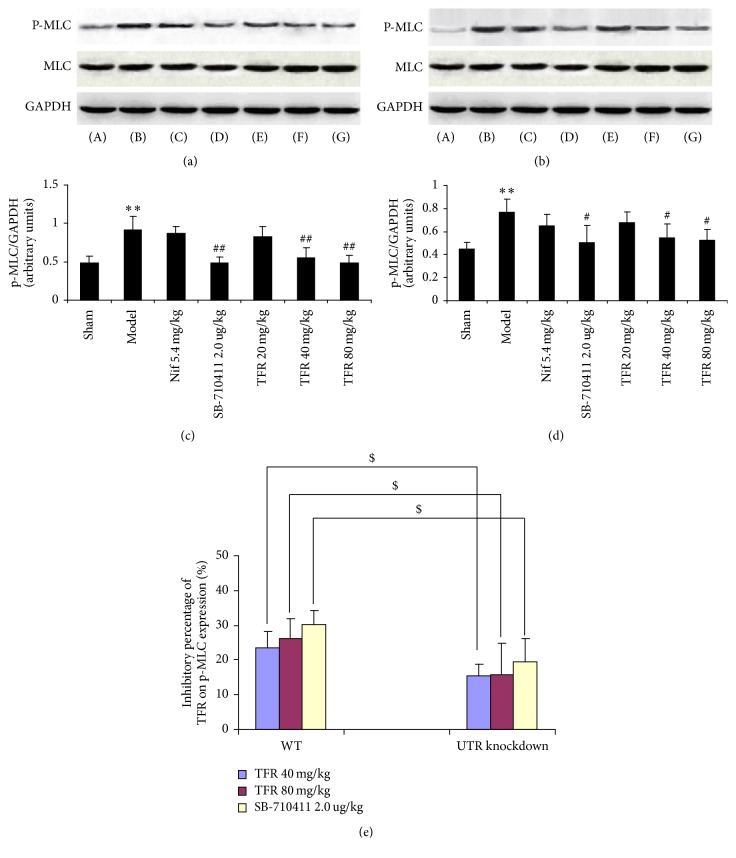
Figure 9.
Effect of TFR on expression of p-MLC/MLC protein. (a) p-MLC/MLC protein in WT rats was detected by Western blot. β-Actin was used as the loading control. (b) p-MLC/MLC protein in UTR knockdown rats was detected by Western blot. β-Actin was used as the loading control. (c) Densitometric quantification of p-MLC protein expression in WT rats. (d) Densitometric quantification of p-MLC protein expression in UTR knockdown rats. (e) The inhibitory percentage of TFR on p-MLC protein expression. (A): sham; (B): model; (C): 5.4 mg/kg nifedipine; (D): 2.0 μg/kg SB-710411; and (E)~(G): 20, 40, and 80 mg/kg TFR. Results are expressed as mean ± SD (n = 6, each group). ∗∗p < 0.01 versus the sham group; #p < 0.05 and ##p < 0.01 versus the model group; $p < 0.05 versus WT rats.

