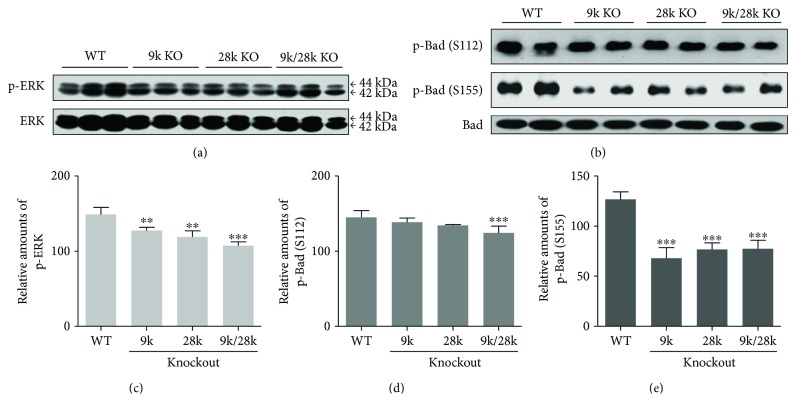
Figure 4.
Phosphorylation of ERK and Bad proteins in the brains of CaBP-9k-, CaBP-28k-, and CaBP-9k/28k-KO mice. Phosphorylation of ERK and Bad (Ser122 and 155) proteins was analyzed by Western blot (a, b). The relative amounts of p-ERK (c), p-Bad (Ser122) (d), and p-Bad (Ser155) (e) were quantified as described in Experimental Procedures. Values are expressed as means ± SD of eight male mice of each group (WT, CaBP-9k KO, and CaBP-9k/28k KO). ∗∗p < 0.01, and ∗∗∗p < 0.001 versus WT.

