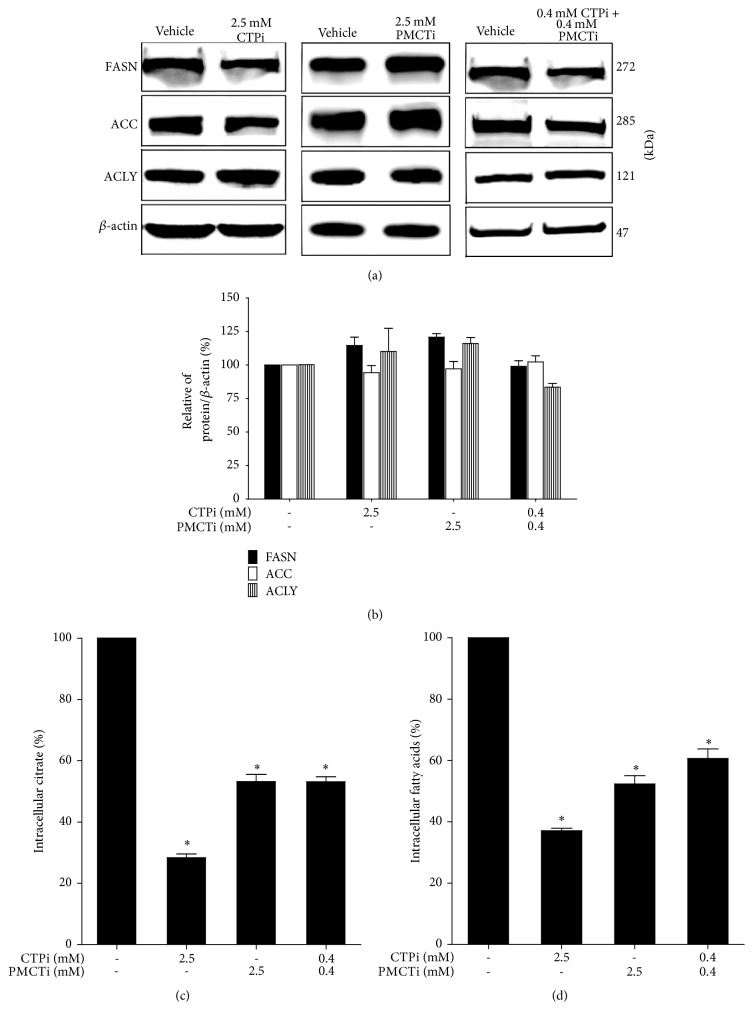
Figure 6.
Effect of citrate transporter inhibitors on DNL pathway in HepG2 cells. Cells were treated with CTPi, PMCTi, and the combination of 0.4 mM of each inhibitor at IC50 concentrations of each for 24 h. The control was defined as a vehicle for which cells were exposed to a medium containing 0.2% DMSO alone. An equal amount of total protein extracts was subjected to an immunoblotting assay to detect expression of FASN, ACC, and ACLY proteins. β-actin was used to normalize equal amount and intensity of protein bands. (a) The expression of lipogenic proteins was detected by immunoblotting technique and visualized using a CCD camera. (b) Quantified density values were obtained and expressed as a percentage of β-actin/protein ratio. (c)-(d) Intracellular citrate and fatty acid levels were quantified as described in materials and methods. The data shows mean ± SEM. ∗ρ < 0.05 from three independent experiments.

