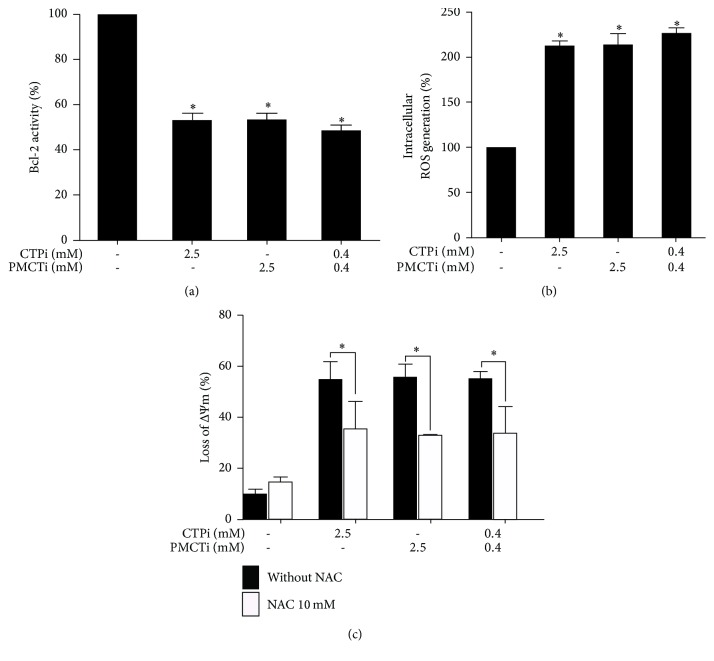
Figure 8.
Effect of citrate transporter inhibitors on apoptosis induction and ROS generation in HepG2 cells. Cells were treated with CTPi, PMCTi, and a combination of each inhibitor for 24 h. (a) Bcl-2 activity was quantified by flow cytometry using Bcl-2 phosphorylation relative to total Bcl-2 expression levels compared with 100% of the control for which cells were treated with a medium containing 0.2% DMSO alone. (b) Intracellular ROS production was measured using flow cytometry. (c) Cells were pretreated with NAC 10 mM for 2 h and incubated with CTPi, PMCTi, and the combination for 24 h, and then ΔΨm was detected by flow cytometry. Data were presented as mean ± SEM, from at least three independent experiments, ∗ρ < 0.05.

