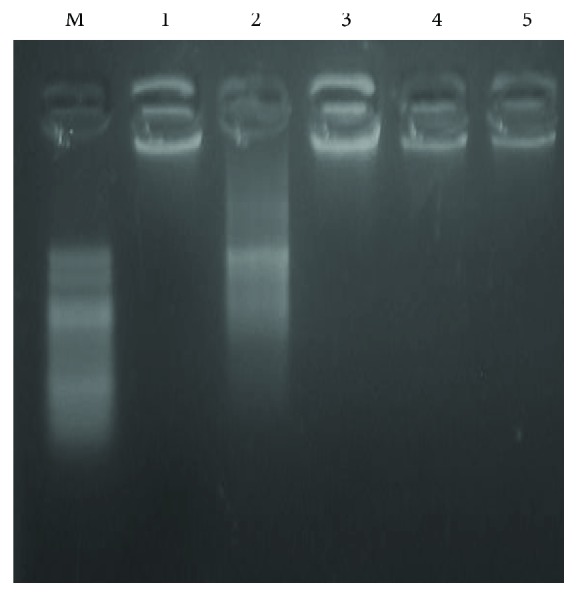
Figure 3.

An agarose gel electrophoresis. Image shows DNA fragmentation. Lane M is a DNA marker with 100 bp. Lane 1 shows intact DNA in the saline-treated group. Lane 2 shows DNA streaks of DNA fragmentation in the doxorubicin group. Lanes 3, 4, and 5 show intact DNA in mice treated with BAs (125, 250, or 500 mg/kg) along with DOX. DOX: doxorubicin; BAs: boswellic acids.
