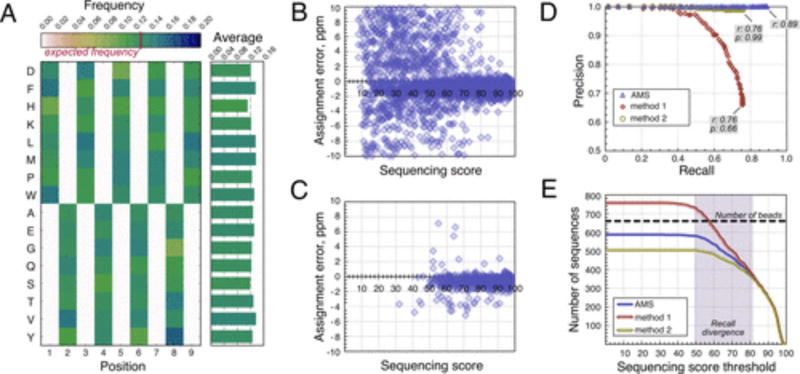
Figure 3.
Alternating monomer set (AMS) increases confidence in sequencing results. All data are from the 660-bead sample of library 1 peptides (587 unique sequences identified). (A) Color-coded positional amino acid frequency is shown on the left, and the mean amino acid frequencies are plotted on the right. Each nonzero cell in the matrix has the expected value of 0.125, and the observed values map closely to it. (B) Sequencing quality scatterplot for the unfiltered PEAKS output. (C) Sequencing quality scatterplot for the final filtered data set. Most peptides with low sequencing score and/or large assignment errors are removed during the postsequencing filtration. (D) Precision-recall curves for different data filtration methods. ALC thresholds (0–99) are applied to the reference and method 1 and 2 data sets, and the corresponding precision and recall values are calculated for each data set. Method 1 is inferior to AMS in both precision and recall. (E) Total number of sequences recovered as a function of sequencing score for different data filtration methods. Results diverge in the region of medium (50–85) sequencing scores.

