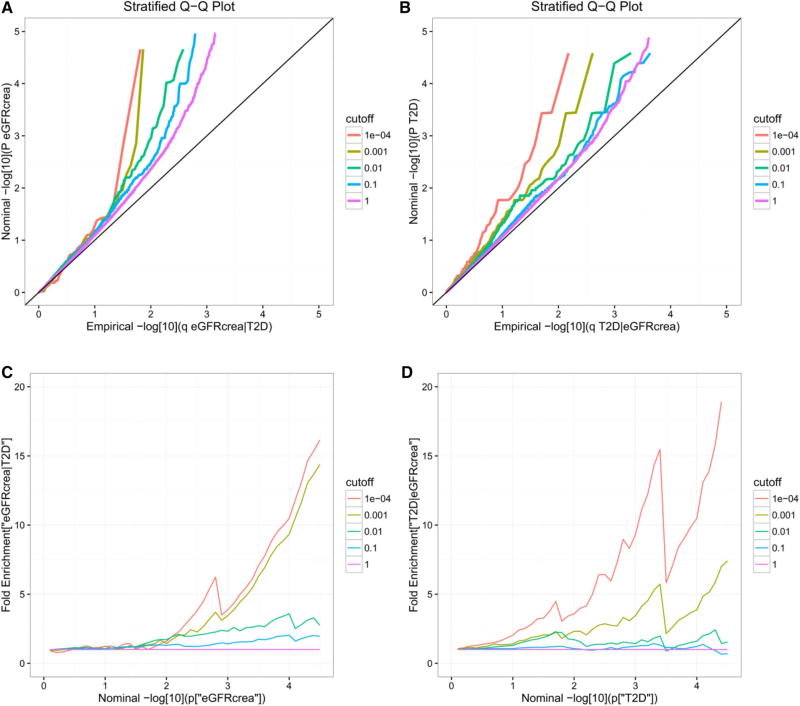
Fig. 1.
Stratified Q–Q (upper panel) and enrichment (lower panel) plots. Upper panel, stratified Q–Q plots of nominal versus empirical − log10 p values in (a) eGFRcrea as a function of significance of the association with T2D, and in (b) T2D as a function of significance of the association with eGFRcrea. Lower Panel: fold-enrichment plots of enrichment versus nominal − log10 p values for (c) eGFRcrea as a function of significance of the association with T2D, and (d) T2D as a function of significance of the association with eGFRcrea. The purple line with slope of zero represents all SNPs

