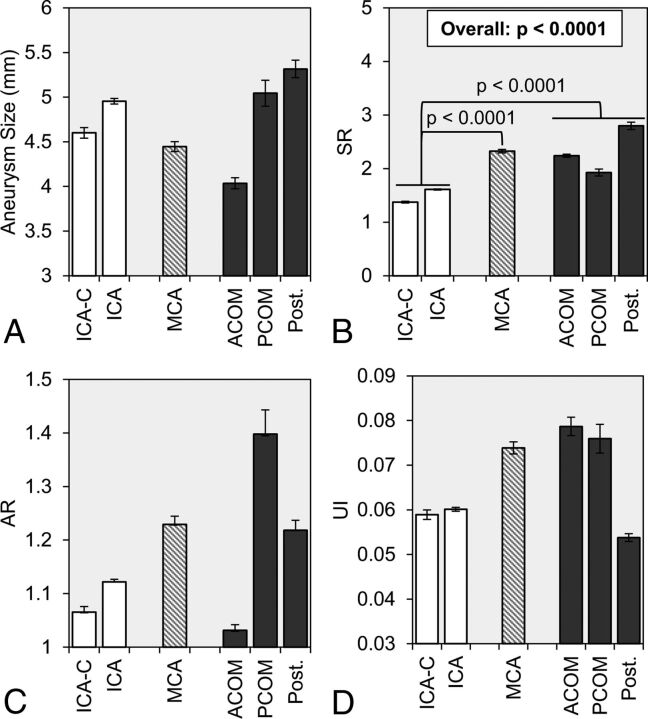
Fig 1.
Statistical comparison of morphologic parameters was performed between 3 location groups: ICA (white), MCA (dashed gray lines), and AcomA, PcomA, and posterior circulation aneurysms (dark gray). The group-averaged values of A, aneurysm size, B, SR, C, AR, and D, UI are given with error bars that represent standard error. The overall P value is given for SR, for which statistical significance was achieved by a mixed model comparison of the 3 groups. In addition, from pair-wise comparisons, the brackets show statistically significant differences between the ICA, MCA, and AcomA/PcomA/Post groups. AR indicates aspect ratio; ICA-C, cavernous internal carotid artery; Post, posterior circulation; UI, undulation index.

