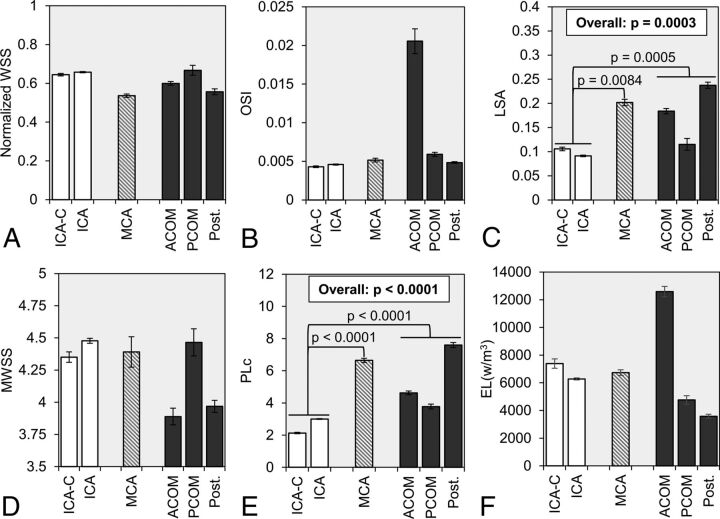
Fig 2.
Statistical comparison of hemodynamic parameters was made between 3 location-based groups: ICA (white), MCA (dashed gray lines), and AcomA, PcomA, and posterior circulation aneurysms (dark gray). The group-averaged values of A, normalized WSS, B, OSI, C, LSA, D, MWSS, E, PLc, and F, EL are given with error bars that represent standard error. The overall P value is given from LSA and PLc, for which statistical significance was achieved by a mixed model comparison of the 3 groups. In addition, from pair-wise comparisons, the brackets show statistically significant differences between the ICA, MCA, and AcomA/PcomA/Post groups. EL indicates energy loss; ICA-C, cavernous internal carotid artery; OSI, oscillatory shear index; Post., posterior circulation; MWSS, maximum normalized wall shear stress.

