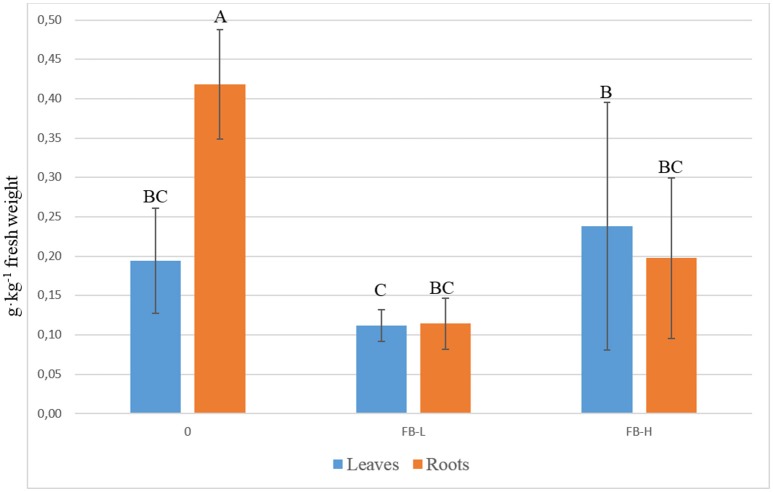
Figure 1.
Concentration of the nitrates according with the part of considered plant and as a function of the experimental treatment—open field. Vertical bars represent the standard deviation. Different letters indicate that mean values are significantly different, according to the LSD method P = 0.05.

