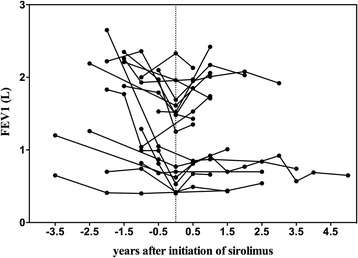
Fig. 1.

Change in FEV1 before and after sirolimus in paired groups. Zero on the horizontal axis indicates the day on which sirolimus therapy was initiated; negative and positive numbers indicate years before and after the initiation of sirolimus administration, respectively. Abbreviations: FEV1, forced expiratory volume in 1 s
