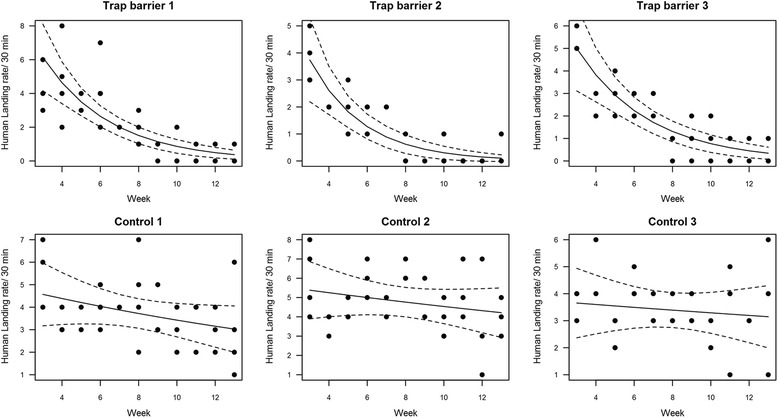
Fig. 4.

Human landing rates at each of the treated (Biobelt trap barrier) and control houses after the beginning of the treatment. The curves represent the results of a generalized linear model with negative binomial distribution

Human landing rates at each of the treated (Biobelt trap barrier) and control houses after the beginning of the treatment. The curves represent the results of a generalized linear model with negative binomial distribution