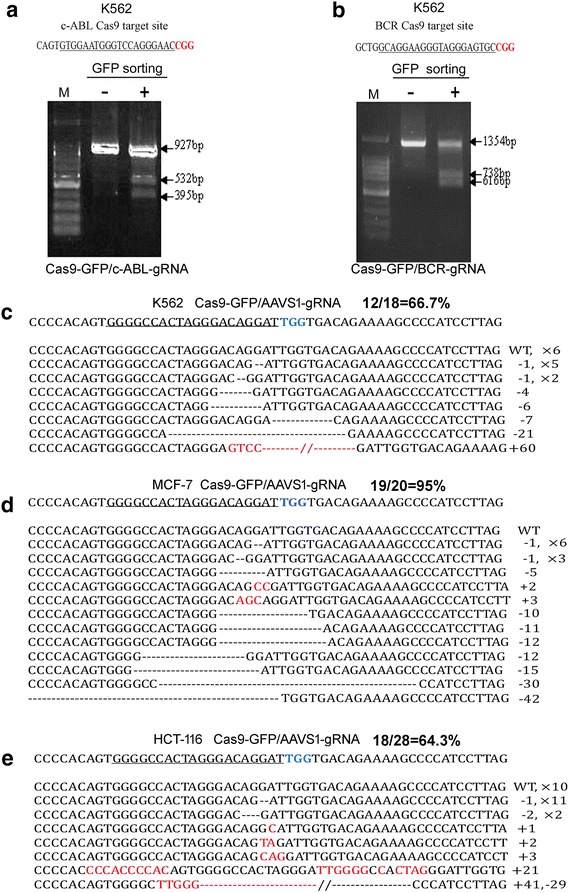
Fig. 1.

The disruption rates induced by transfecting Cas9, eGFP and sgRNA co-expression vector for three genomic loci in different cancer cell lines. a and b show the disruption efficiency induced by transfecting Cas9, eGFP and sgRNA co-expression vector in c-ABL and BCR gene loci in K562 cells as determined by T7E1 assay. “−” represents cells without GFP sorting; “+” represents cells with GFP sorting; and “M” represents DNA size marker. c–e show the disruption rate induced by transfecting Cas9, eGFP and AAVS1-sgRNA co-expression vector in K562, MCF-7 and HCT-116 cells using TA cloning and sequencing analysis. Approximately 20–30 TA clones were randomly picked up for DNA sequencing, and the disruption rate (%) was calculated based on DNA sequencing. All cells were transfected with 4 μg of pCS2-Cas9-IRES-GFP-polyA-gRNA (AAVS1) co-expression vector. Seventy-two hours after transfection, GFP-positive cells were enriched through FACS sorting and genomic DNA was extracted from the sorted cells. The PCR amplification, T7E1 assay and TA cloning into PMD18-T vector were performed as described in “Methods”
