
Fig. 1.
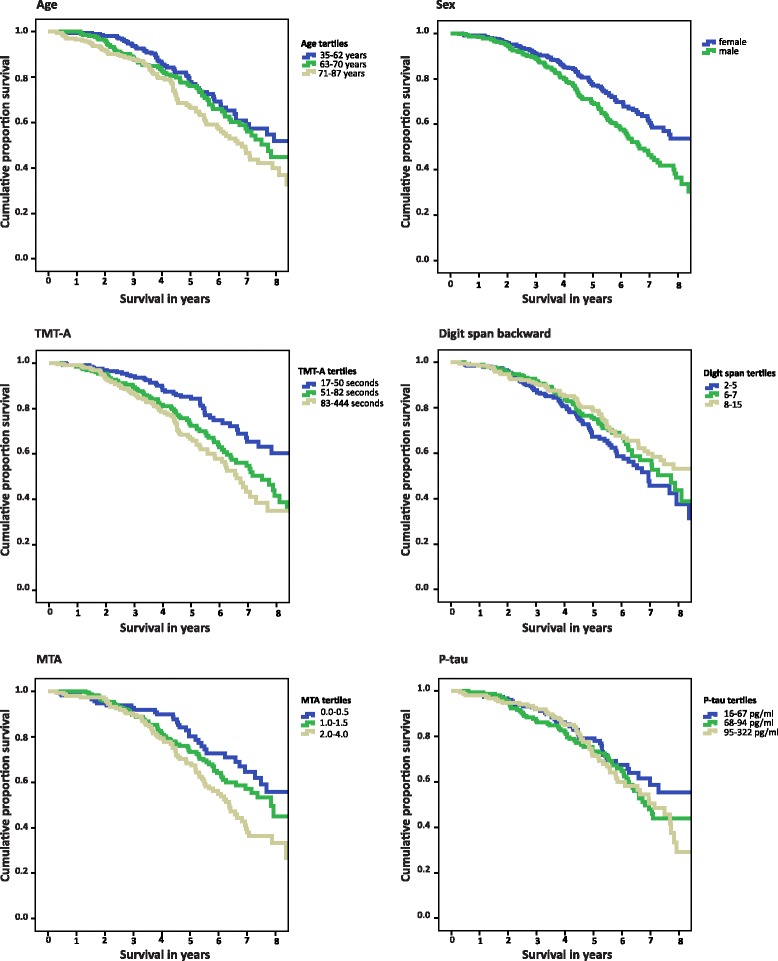
Kaplan-Meier curve, according to variables from forward selection model: age, sex, TMT-A, digit span backward, MTA, and p-tau (all except sex stratified in tertiles). Legend: Note: digit span backward: range 0-21, TMT: trail making test (no range), MTA: medial temporal lobe atrophy ranging 0-4 (average score of left and right side), p-tau: tau phosphorylated at threonine 181. Survival curves were calculated using raw data, without imputation