. 2018 Feb 20;4:53. doi: 10.1186/s40814-018-0248-x
© The Author(s). 2018
Open AccessThis article is distributed under the terms of the Creative Commons Attribution 4.0 International License (http://creativecommons.org/licenses/by/4.0/), which permits unrestricted use, distribution, and reproduction in any medium, provided you give appropriate credit to the original author(s) and the source, provide a link to the Creative Commons license, and indicate if changes were made. The Creative Commons Public Domain Dedication waiver (http://creativecommons.org/publicdomain/zero/1.0/) applies to the data made available in this article, unless otherwise stated.
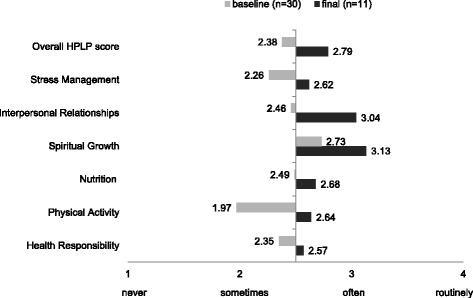
Fig. 3.

Distribution of Health-Promoting Lifestyle Profile II (HPLP-II) average values of overall score and subscales
