Fig. 2.

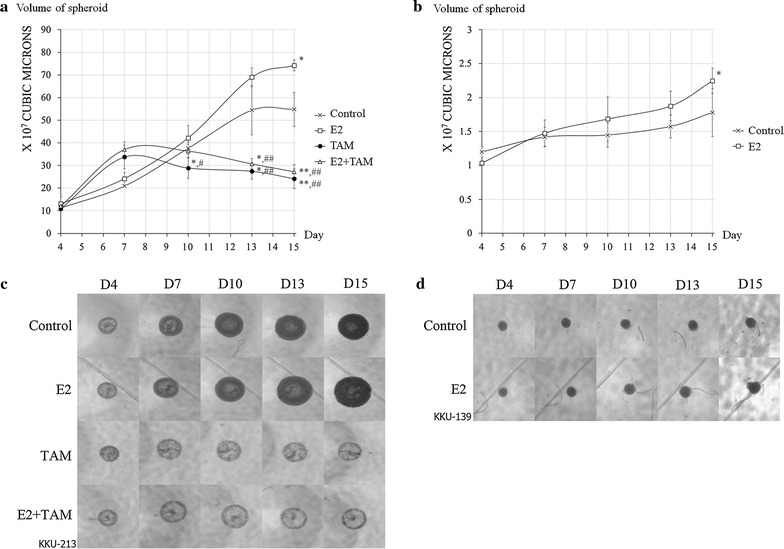
Estrogen stimulated proliferation of CCA cell lines in a 3D system. a Diagrammatic growth curve of KKU-213. b Diagrammatic growth curve of KKU-139. c Representative picture of KKU-213 spheroids. d Representative picture of KKU-139 spheroids. Experiments were performed as quadruplicated experiments. Symbol * and ** determined statistically significant difference compared to untreated control group with P < 0.05 and < 0.001, respectively. Symbol # and ## determined statistically significant difference compared to E2 treated group with P < 0.05 and < 0.001, respectively
