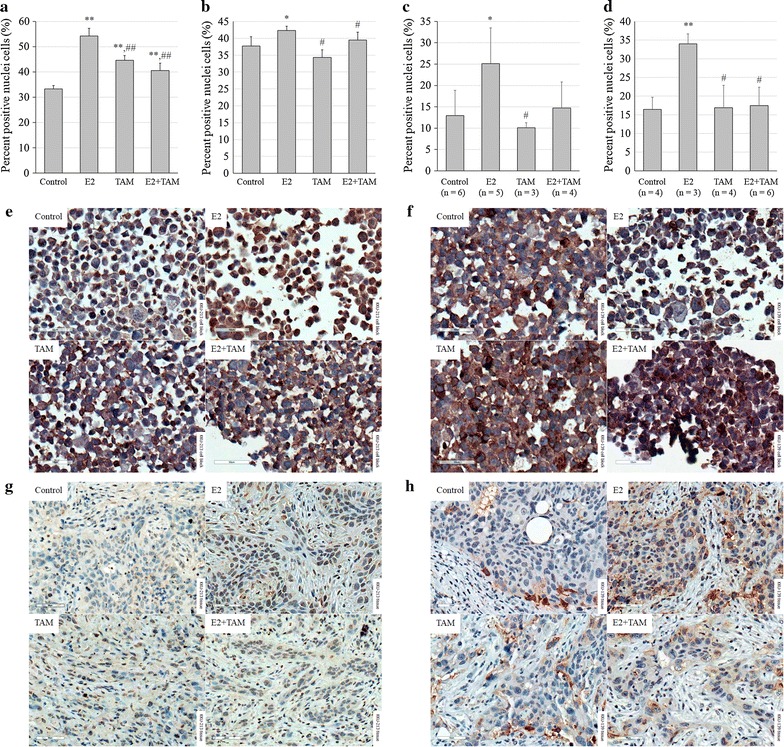
Fig. 5.

Relative nuclear expression of ETV4 protein in CCA cell lines treated with E2 and/or TAM compared to untreated control: a KKU-213 treated in vitro; b KKU-139 treated in vitro; c KKU-213 xenografted tumor masses; d KKU-139 xenografted tumor masses; e ETV4 staining of KKU-213 cell block; f ETV4 staining of KKU-139 cell block; g ETV4 staining of KKU-213 xenografted tumor masses; h ETV4 staining of KKU-139 xenografted tumor masses. For in vitro experiments, analyses were performed from five different fields. Number of mice (n) in each group was determined in diagrams. Cells with dark brown nuclei were counted as positive, in contrast to pale blue nuclei which were not considered positive. Original magnification of all analyzed images was 400×. Scale bar = 50 µM. Symbol * and ** determined statistically significant difference compared to untreated control group with P < 0.05 and < 0.001, respectively. Symbol # and ## determined statistically significant difference compared to E2 treated group with P < 0.05 and < 0.001, respectively
