
Fig. 2.
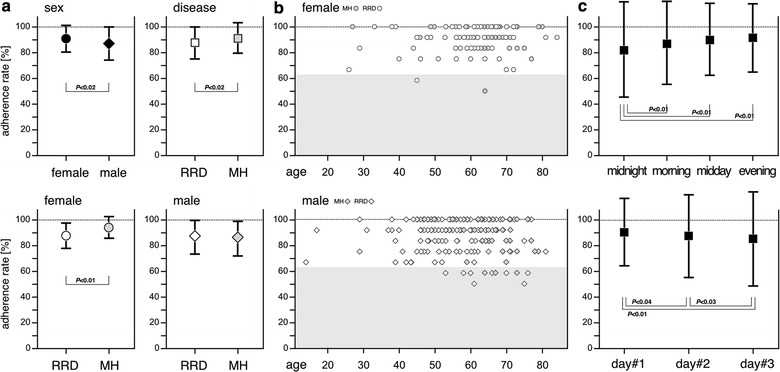
Adherence rates. a Mean adherence rates: the mean adherence rates were compared between female and male patients (top left panel) and between patients with RRD and those with MH (top right panel); single-gender comparisons of diseases were performed among female (bottom left) and male (bottom right). P values were obtained using the Mann–Whitney U test. b Distribution of adherence rates: function of patient age in female (top panel) and male (bottom panel) patients. c Summarized plots for daily (upper panel) and day-by-day (lower panel) variations: P values were obtained using Cochran the Q test with Bonferroni correction