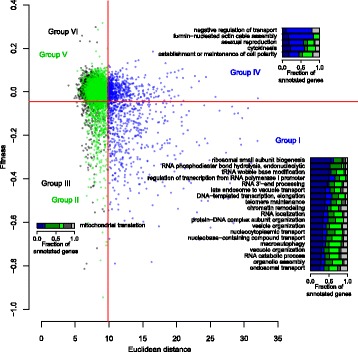
Fig. 6.

Functional enrichment in gene groups specified by fitness and morphology. Functional enrichment in gene groups I–VI. The scatter plot, colored dots, and solid red lines are as shown in Fig. 4a. Bar graphs associated with each group indicate the fractions of genes annotated with each adjacent gene ontology (GO) term. Bar colors: dark blue, dark green, dark gray, blue, green, and gray indicate gene groups I, II, III, IV, V, and VI, respectively
