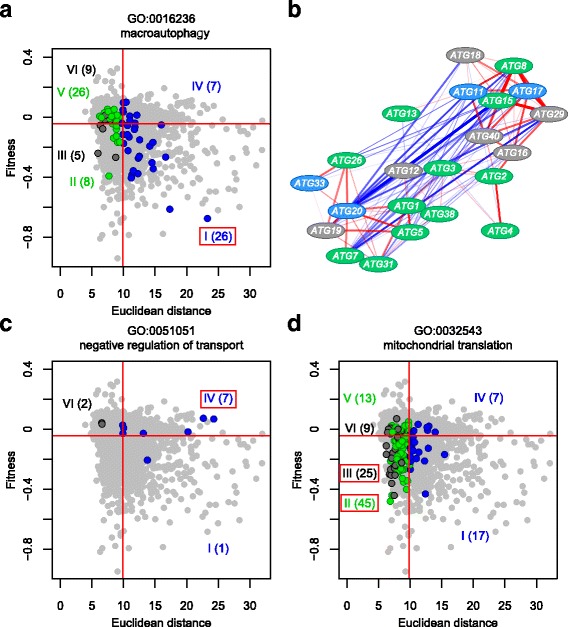
Fig. 7.

Distribution of deletion mutants for genes annotated to specific GOs. a Group I related to autophagy (GO:0016236). b Morphological similarity among autophagy-related gene deletion mutants. The subnetwork was described using Cytoscape (http://www.cytoscape.org/) and nodes were placed using the spring-embedded layout. Colors of nodes represent genes in group I and IV (blue), group II and V (green), group III and VI (gray) Red and blue edges indicate positive and negative correlations with morphological phenotype, respectively. Transparency of colors at edges is proportional to absolute R value. Wide, medium, and narrow edges indicate strong (0.6 < R value ≤0.8), moderate (0.4 < R value ≤0.6), and weak correlations (0.2 < R value ≤0.4), respectively. c Group IV related to negative regulation of transport (GO:0051051). d Groups II and III related to mitochondrial translation (GO:0032543). Blue, green, and dark gray circles indicate mutants of genes annotated with specific GOs. Gray circles indicate mutants of genes not annotated with the specified GOs. The number of annotated genes in each group is shown in parentheses. Red frames indicate gene groups related to a specific GO. The scatter plot, colored dots, and solid red lines are as shown in Fig. 4a
