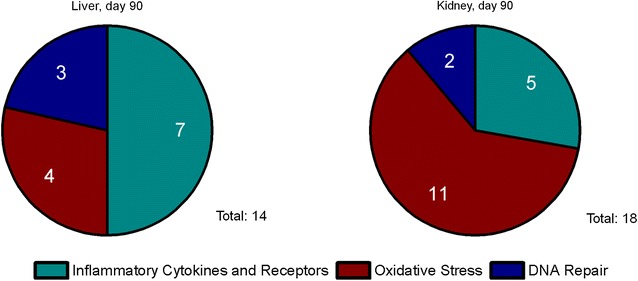
Fig. 11.

Number and distribution of regulated genes in liver and kidney. The number of regulated genes in liver and kidney tissue after 90-day nanoparticle exposure is illustrated per pathway (pool of all treatment groups)

Number and distribution of regulated genes in liver and kidney. The number of regulated genes in liver and kidney tissue after 90-day nanoparticle exposure is illustrated per pathway (pool of all treatment groups)