Fig. 2.

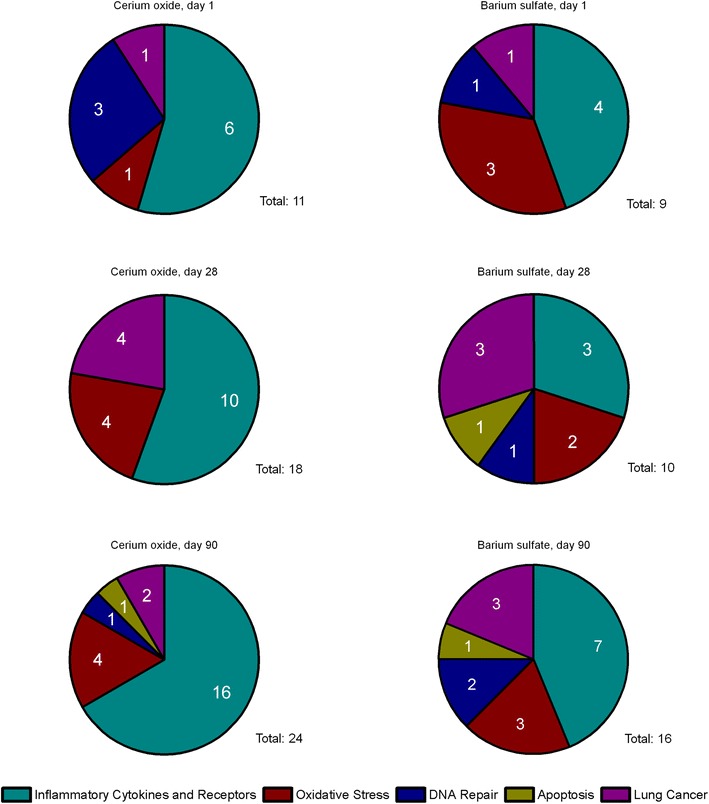
Distribution of regulated genes over the analyzed pathways. The number of regulated genes in isolated AEII cells after CeO2 nanoparticle (pool of all dose groups) and BaSO4 nanoparticle exposure is illustrated per time point and pathway

Distribution of regulated genes over the analyzed pathways. The number of regulated genes in isolated AEII cells after CeO2 nanoparticle (pool of all dose groups) and BaSO4 nanoparticle exposure is illustrated per time point and pathway