
Fig. 7.
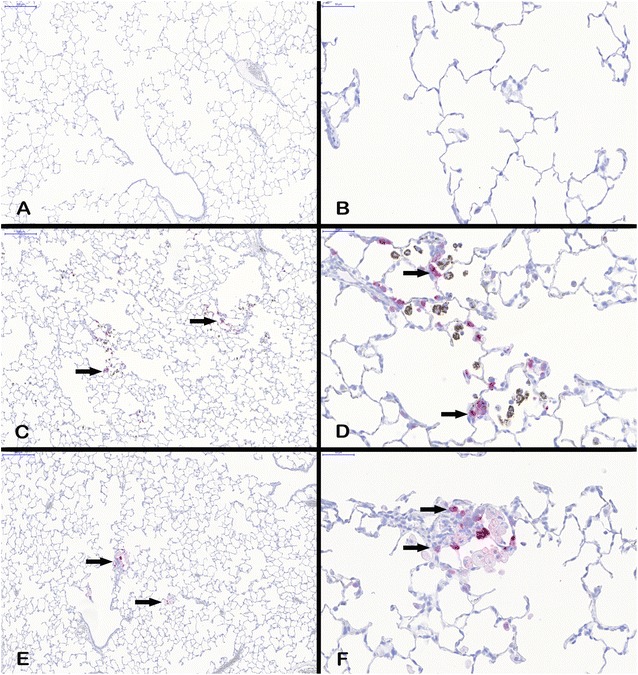
Lpo protein expression in lung tissue. All examples illustrate findings after 90-day nanoparticle exposure. A lung tissue overview, ×10, and B detailed view, ×40, after clean air exposure, C Lpo positive cells (arrows) in lung tissue overview, ×10, and D detailed view, ×40, after 3.0 mg/m3 CeO2 exposure, and E Lpo positive cells (arrows) in lung tissue overview, ×10, and F detailed view, ×40, after 50.0 mg/m3 BaSO4 exposure. The images show Lpo-positive cells counterstained with hematoxylin